Price analysis 4/24: BTC, ETH, BNB, SOL, XRP, DOGE, TON, ADA, AVAX, SHIB

Bitcoin and altcoins continue to be rocked by macroeconomic and geopolitical uncertainty, but data shows bulls continue to buy each dip.
Solana Memecoins WIF And BONK Explode By Double Digits: Key Reasons
Two Solana-based memecoins, Bonk (BONK) and Dogwifhat (WIF), have registered substantial gains over the past 24 hours. BONK recorded a 35% increase, while WIF climbed by 19%, positioning them among the top three gainers in the top 100 cryptocurrencies by market cap today. Only Hedera Hashgraph (HBAR) surpassed them, with a notable 44% rise during the same period.
Resolution Of Solana’s Congestion Issues Spurs Memecoins
The significant uptick in these Solana memecoins is closely linked to the recent improvements in the Solana network’s performance. A tweet from SolanaFloor earlier today indicated, “BREAKING: Solana’s congestion issues have been completely resolved, with block production back to normal. Transactions confirming in under 2 seconds.” This announcement marks a pivotal moment for the network which had been plagued by congestion issues.
Source A: https://t.co/2TVnbaPNlHSource B: https://t.co/GfHxy8dC1B
— SolanaFloor | Powered by Step Finance (@SolanaFloor) April 24, 2024
On April 15, Solana developers rolled out crucial updates designed to alleviate these problems, urging validators to adopt version v1.17.31. This version introduces changes in the treatment of validators based on their stakes. Further enhancements are anticipated with the release of version v1.18 next month, which will include a new scheduler, albeit disabled by default.
Andrew Kang, founder of Mechanism Capital, remarked a few days before the fix, “Let’s also not forget that the Solana congestion issues have weighed down SOL and Solana-based memecoins significantly. It’s not a question of if but when the network is significantly improved. That’s your springboard.” Kang’s comments now seem prophetic as the resolution of network issues has indeed acted as a springboard for memecoin valuations.
Specifics On Rally Of Dogwifhat (WIF) And BONK
The price of WIF soared to a 24-hour high of $ 3.43 on April 24, buoyed by an impressive 96% increase in trading volume. This influx was fueled by notable acquisitions from whales like Ansem, who capitalized on the positive market sentiments.
The breakout above the resistance level at $ 3.18, after a week of sideways trading between $ 1.97 and $ 3.18, was a significant trigger. WIF formed a two-week-long ascending triangle, a bullish chart pattern that indicated a continuation of the previous upward trend. The breakout was widely discussed in the crypto community, with trader Bluntz Capital confirming the pattern’s resolution and sparking further bullish sentiment.
2 week long ascending triangle forming here on $ WIF, i think the breakout is imminent pic.twitter.com/S0OZWBsq6u
— Bluntz (@Bluntz_Capital) April 24, 2024
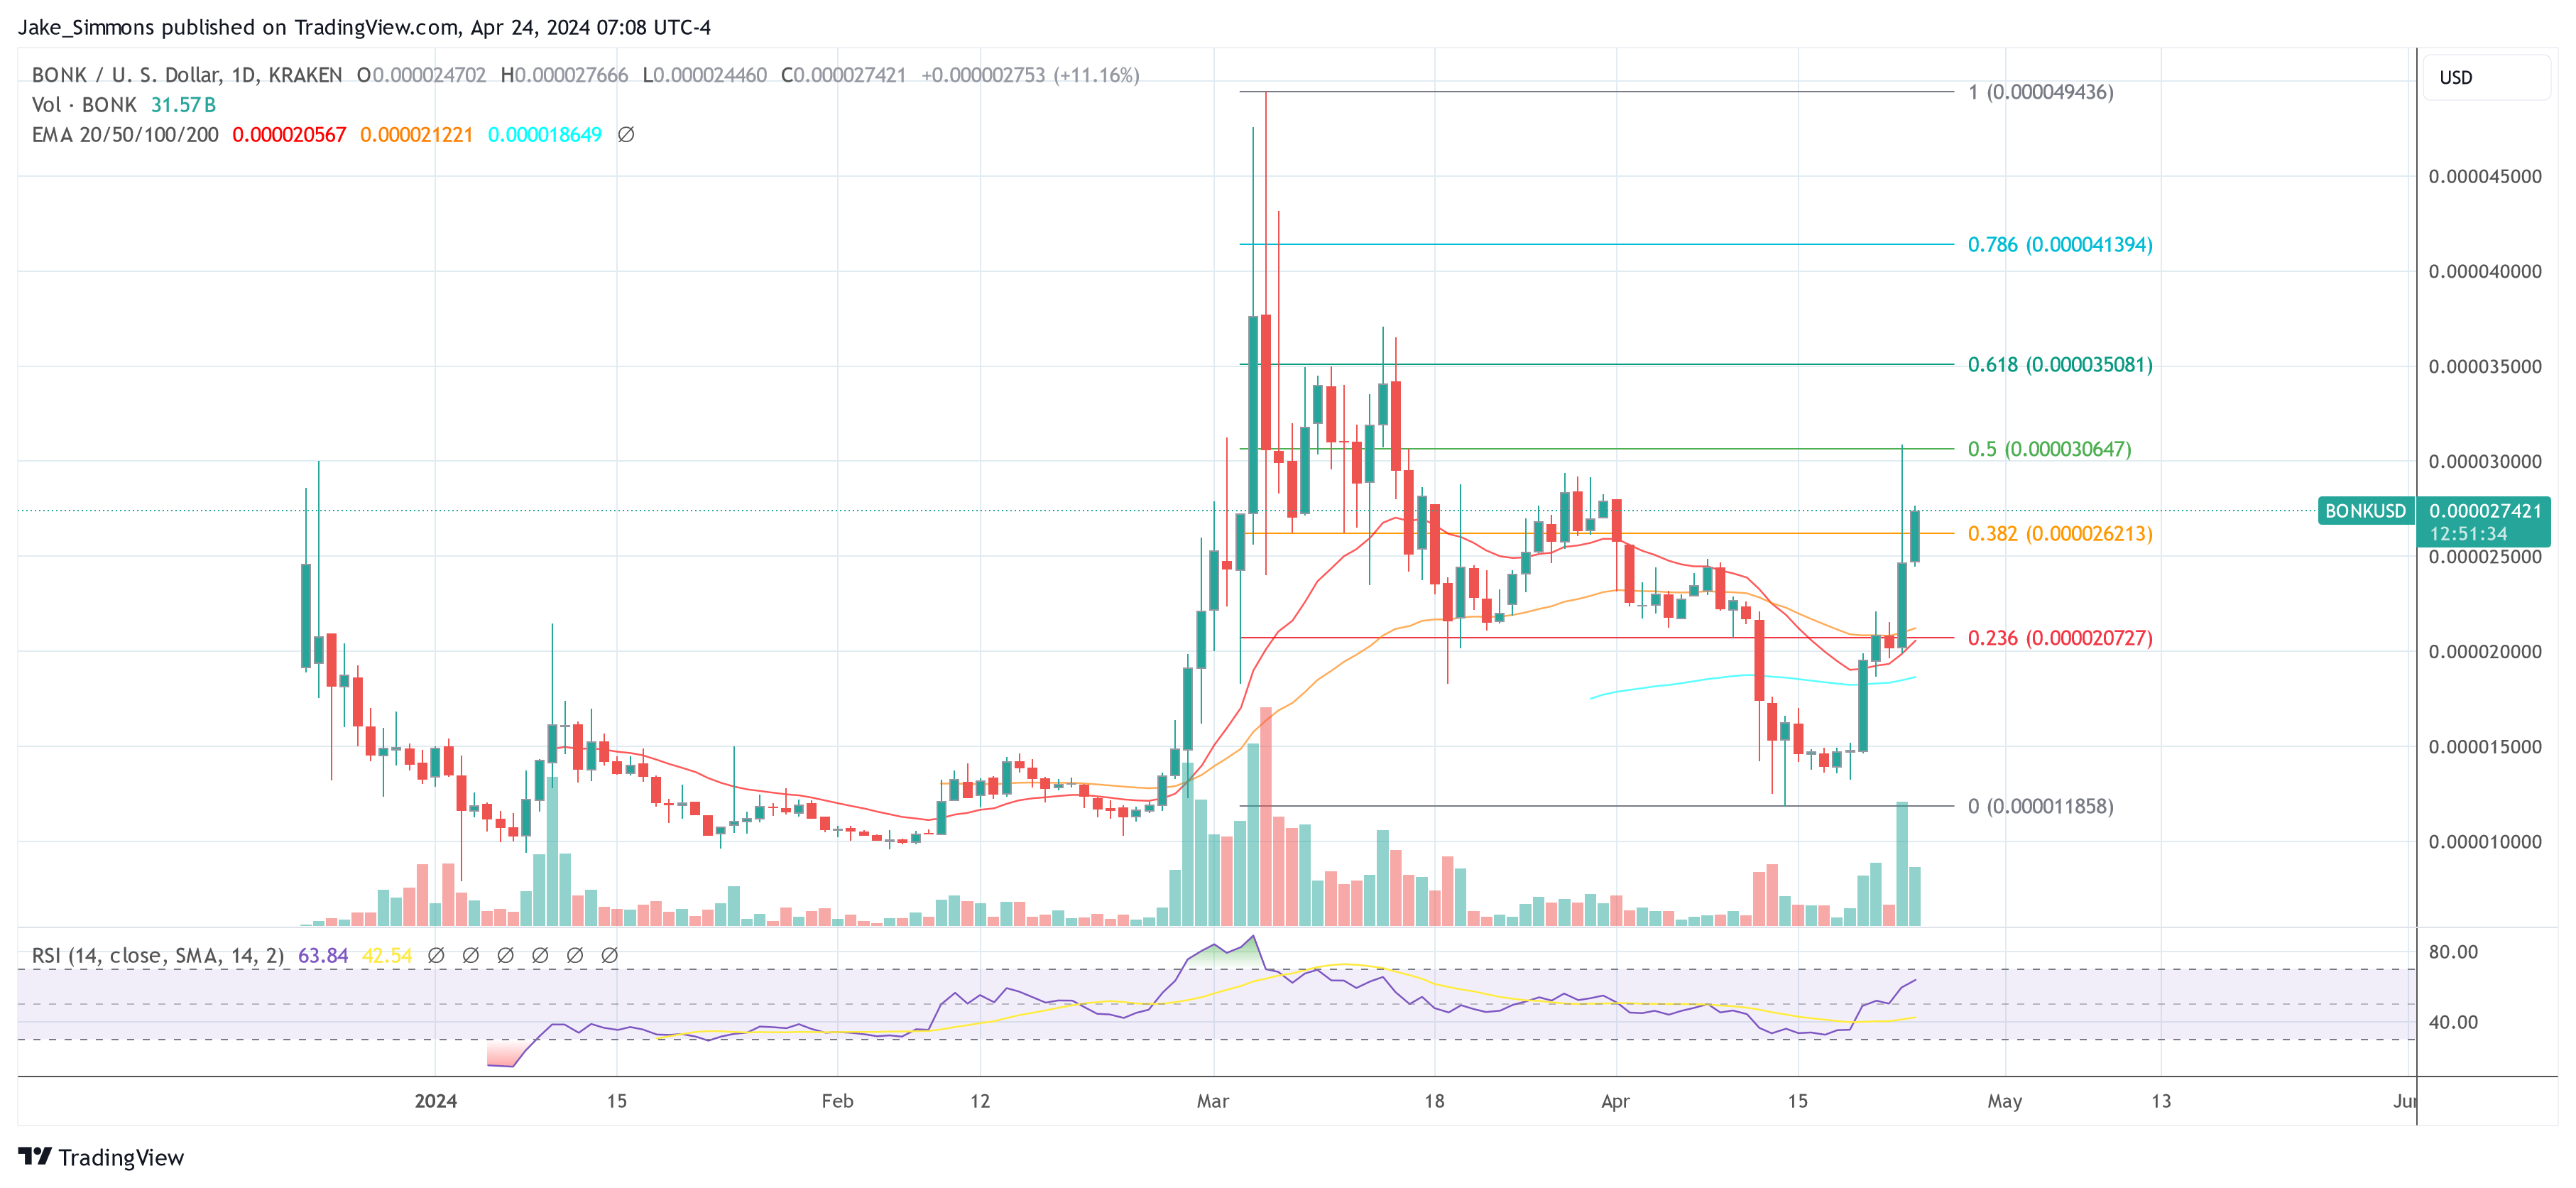
BONK is registering a dramatic 35% rise, with a remarkable 304% increase in trading volume. The price action successfully breached the 0.236 Fibonacci retracement level at $ 0.000020727, and continued its upward trajectory to the 0.5 Fibonacci level, signaling strong buying interest and bullish momentum.
This rally probably gained additional support from the recent listing of BONK by the global neobank Revolut, which was announced on April 22. This inclusion in Revolut’s trading platform, which features over 150 digital currencies, provided significant exposure and legitimacy, further enhancing investor interest and market activity around BONK.
Ripple Vs. SEC Update: Is The Lawsuit Finally Coming To An End With A Settlement?
The legal battle between Ripple and the Securities and Exchange Commission (SEC) is getting heated and, following recent developments, looks far from over. This is due to the disagreement between both parties on the appropriate remedy for Ripple’s violation of securities laws.
Ripple Proposes $ 10 Million Fine Instead
In opposition to the SEC’s motion for remedies and entry of final judgment, Ripple has proposed that the court should not impose a civil penalty of not more than $ 10 million. This figure represents a far cry from the SEC’s proposed judgment. The Commission had earlier asked the court to order Ripple to pay the sum of $ 1,950,768,364 as a pecuniary fine for violations relating to its institutional XRP sales.
Specifically, the SEC proposed that Ripple pay a civil penalty of $ 876,308,712 alongside a prejudgment interest of $ 198,150,940 and disgorgement of $ 876,308,712, which represents the profits from its violation of the Securities Act. However, Ripple asked the court to deny the requests for disgorgement and pre-judgment interest and only focus on the civil penalty, which shouldn’t be more than $ 10 million.
Ripple’s lawyers also laid out arguments as to why the civil penalty should not exceed $ 10 million. Firstly, they stated that the first tier of the statutory maximum penalties is what applies to this case “because the SEC has never alleged fraud, deceit, or manipulation and has failed in its belated attempt to show that Ripple recklessly disregarded the law.”
Therefore, Ripple argued that the Commission’s request for a civil penalty of over $ 876 million isn’t the appropriate remedy for the first-tier structure. They added that the company’s revenue from pre-complaint institutional sales should be the only earnings considered when deciding on a remedy, which makes a civil penalty of not more than $ 10 million more appropriate.
Accounting Error From The SEC
Ripple suggested that the SEC made an error in calculating the company’s earnings while deciding on the right amount for which the crypto firm should be fined. According to the company’s lawyers, the Commission failed to “analyze or even consider any other categories of Ripple’s expenses.”
Meanwhile, they allege that the SEC didn’t offer any evidence or explanation “for why cost if revenue is the only category of Ripple’s deductible expenses.” Simply put, Ripple argues that the regulator, while calculating Ripple’s earnings, didn’t consider how much the company expended before deciding that almost $ 2 billion was an appropriate fine.
Ripple’s lawyers made this argument while stating that the SEC also erred in relying on the declaration of Andrea Fox, an accountant at the agency. They claim that the SEC never disclosed Fox as a fact or expert witness and that she wasn’t deposed during the initial discovery or supplemental remedies discovery. Therefore, they moved to strike her declaration as an “untimely disclosed expert report.”
Ripple Also Opposes SEC’s Proposed Injunction
As part of its entry for final judgment, the SEC had asked the court to “permanently” restrain and enjoin Ripple from “directly or indirectly conducting an unregistered offering of Institutional Sales.” Understanding how this could affect their ODL transactions, Ripple has asked the court to deny the request for an injunction.
The crypto firm argues that the Commission has failed to show why an injunction is warranted. Injunctions are usually granted when there is a fear of future violations. Ripple claims that the SEC has failed to show a “reasonable likelihood of future violations.”
The crypto firm’s lawyers further revealed that Ripple has “changed the way it sells XRP and changed its contracts to avoid any future violations.” To show good faith, they submitted a declaration by Ripple’s President, Monica Long, which describes the steps the company has taken to avoid future violations.
Analyst Outlines XRP Price Scenarios Ahead Of Ripple-SEC Case Update
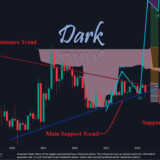
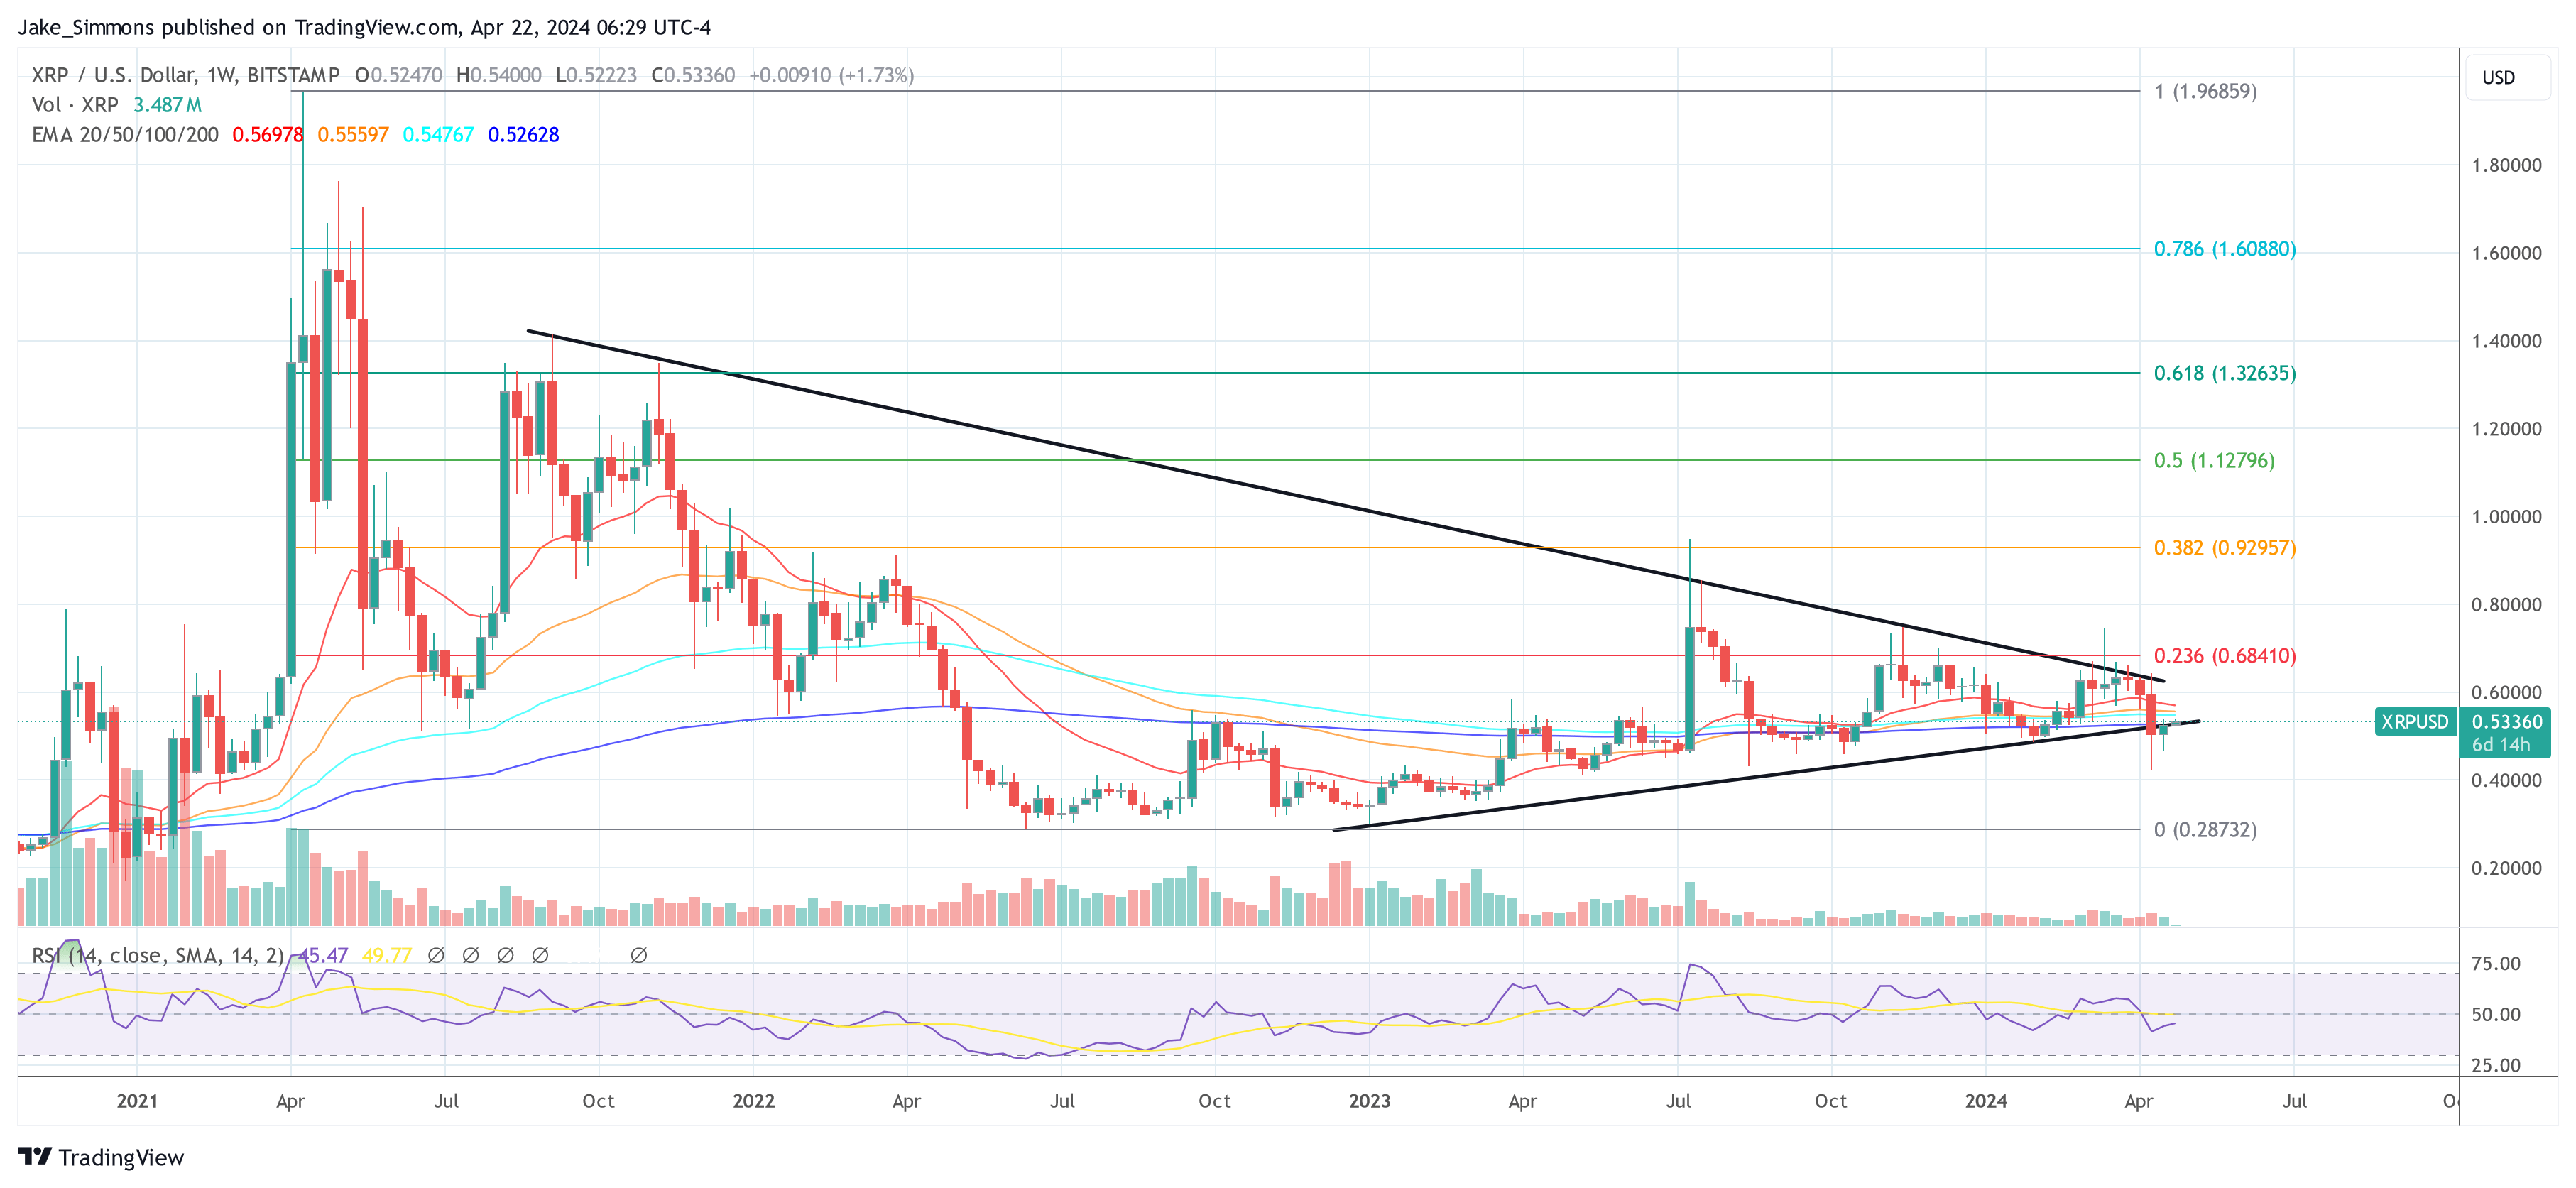
In a chart analysis shared via X, the crypto analyst Dark Defender provided insight into the potential price movements of XRP ahead of this week’s Ripple-SEC case update. The analysis, conducted on a monthly time frame, reveals that XRP has been holding above a critical support trend marked in blue. With the crypto community’s eyes set on the new Ripple filings expected next week, there’s a mix of anticipation and caution.
XRP Price Enters Potentially Crucial Week
Dark Defender notes that although market news does not typically have a direct correlation with price movements, the “last puzzle piece” pertaining to the Ripple case may add a layer of enthusiasm to the market sentiment surrounding XRP. The question posed is: What could happen if XRP fails to maintain its position above the blue support line?
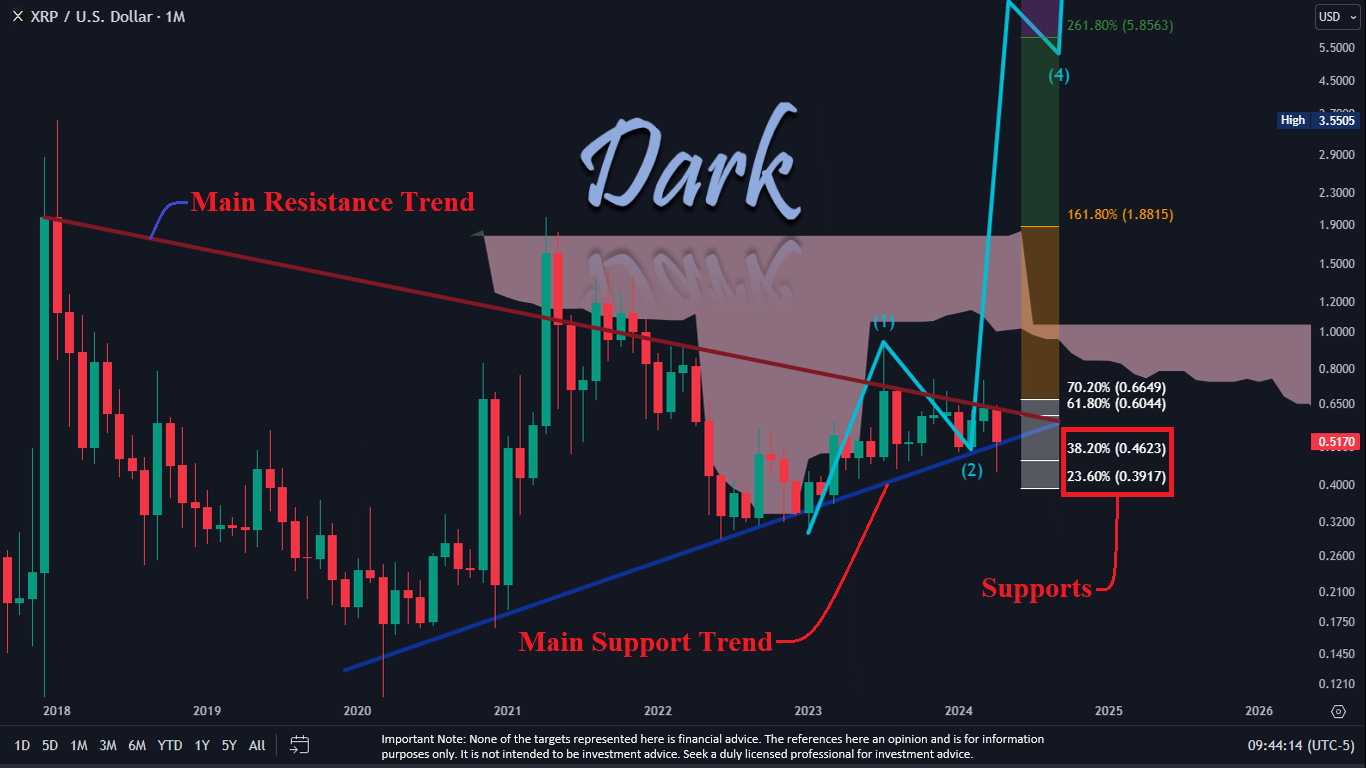
According to the analysis, if XRP breaks below this blue support line, it will likely approach the two critical Fibonacci retracement levels at $ 0.4623 (38.2% retracement level) and $ 0.3917 (23.6% retracement level). These figures are derived from the swing high and low points on the chart, traditionally considered potential support levels where the price could stabilize or bounce back.
In the context of the current chart, a drop below these levels, particularly if the price closes under $ 0.3917 for two to three days consecutively, would invalidate the bullish five-wave structure that Dark Defender suggests could propel XRP to a high of $ 5.85. On the flip side, should XRP reclaim the 61.8% Fibonacci level at $ 0.6044, it could signify a first step towards a strong upward move.
Between the price range of $ 0.6649 and $ 0.3917, any price movement is considered a sideways trend. A breakout above the 70.2% level at $ 0.6649 would likely confirm a bullish trend, with the analyst highlighting this as a significant threshold for a positive price trajectory. Above this level, XRP would then eye the next Fibonacci extension levels of $ 1.8815 (161.8% extension) and potentially $ 5.8563 (261.8% extension), which are ambitiously projected targets.
The chart also highlights a “Main Resistance Trend” line that has capped the price since the peak of early 2018, and the current price action is pinched between this descending resistance and the ascending support trend lines, forming a converging pattern that traders often interpret as a potential breakout signal.
A breakout could be the first bullish indication of a larger rally, with at least one monthly close above the line required. In the past, several attempts at a breakout have failed, and even one monthly close was followed by a fall back below the trendline the following month.
Ripple Vs. SEC: What To Expect This Week
Ripple Labs is gearing up to file its response to the US Securities and Exchange Commission’s (SEC) remedies briefing on April 22, a pivotal moment in their protracted legal battle. This response from Ripple is in reaction to the SEC’s briefing that put forth potential remedies including disgorgement of profits derived from XRP sales and civil penalties. The financial stakes are high, with the SEC calculating fines that could reach around $ 2 billion, claiming that Ripple engaged in an unregistered securities offering with its XRP sales.
The legal and financial communities expect Ripple to mount a formidable defense against the SEC’s claims. Key to this counter-argument will be undermining the SEC’s assertion of the necessity for disgorgement, given the alleged lack of demonstrable financial harm to XRP purchasers. Furthermore, Ripple is likely to leverage favorable recent legal decisions and regulatory developments, aiming to weaken the SEC’s position.
According to the schedule, Ripple is expected to submit a public redacted version of its opposition brief along with associated declarations and exhibits today, if these materials are devoid of any SEC-designated confidential information. If confidentiality is a concern, Ripple will file the documents under seal and submit a redacted public version by April 24. Following this, the SEC will have the opportunity to reply, with their response anticipated to be filed under seal by May 6.
At press time, XRP traded at $ 0.53.
Crypto Analyst Sounds Buy Alarm For Dogecoin – Can DOGE Price Reclaim $0.2?
The DOGE price has largely struggled to make a return to $ 0.2 since losing this price level early in April. And the meme coin has mostly been on a descent over the past few weeks, going as low as $ 1.4 at some point.
However, the tides appear to be shifting for the Dogecoin investors, with the meme token putting in a positive price performance in the past week. The double-digit gain and optimistic price action over the last seven days haven’t gone unnoticed by experts, as many anticipate a continued bullish run for the DOGE price in the near future.
Is A Price Rally Imminent For Dogecoin?
Prominent crypto analyst Ali Martinez took to the X platform to share an interesting analysis and projection for the Dogecoin price. According to the pundit, DOGE’s recent price action is signaling a potential rally to the upside over the coming days.
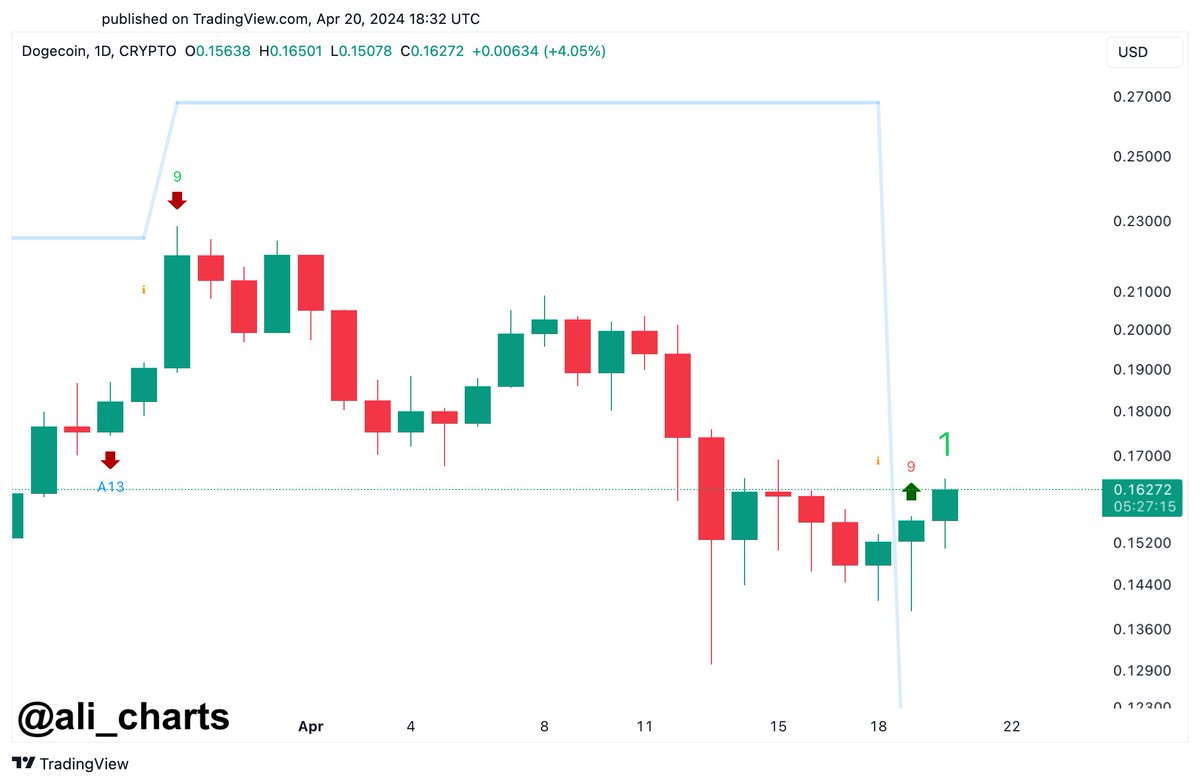
The reasoning behind this bullish prediction revolves around the TD (Tom Demark) Sequential indicator. Martinez mentioned that this indicator has flashed a buy signal on Dogecoin’s daily chart, suggesting that a price upswing lasting between one to four days might be on the cards.
The Tom Demark Sequential is an indicator in technical analysis used to identify potential points of trend exhaustion and price reversal. Typically, the TD Sequential indicator comprises two major phases known as the “setup” and the “countdown.”
The setup phase consists of nine consecutive candlesticks depending on whether the token is in a bullish or bearish trend. The countdown phase, on the other hand, consists of 13 consecutive candlesticks, which start immediately after the completion of the “setup.”
In the chart highlighted above, the DOGE price just completed the nine-candle setup phase, which may be signaling a potential price reversal. Given that this phase was mostly formed by bearish candles, the TD Sequential might be indicating a bottom for Dogecoin’s price.
Ultimately, it is likely that investors will see the DOGE price return to $ 0.2 if the potential rally produces four consecutive bullish candles. However, they might keep an eye out for the formation of the “countdown” phase.
The completion of the countdown phase on Dogecoin’s daily chart could signal an even stronger and longer-lasting price reversal. This could see the meme token break out of its current bearish trend and gather some momentum for higher price levels.
DOGE Price At A Glance
As of this writing, the DOGE price stands at around $ 0.1618, reflecting a significant 4.7% increase in the past 24 hours.
Bitcoin Set To Soar To $200,000 Post-Halving: Skybridge Founder
In a recent interview on the future of Bitcoin, Anthony Scaramucci, the founder and managing partner of Skybridge Capital, has made a compelling prediction that the Bitcoin price could potentially reach $ 200,000 following its forthcoming halving event. This forecast comes at a time of considerable volatility within the crypto markets, exacerbated by recent geopolitical tensions and broader economic uncertainty.
Bitcoin Poised To Hit $ 200,000
During the interview, Scaramucci provided insights into the forces he believes will drive Bitcoin’s price in the coming months. “Well, I mean, look, you could get shocks like wars and you could get, you know, God forbid a terrorist calamity or something like that that could take Bitcoin down 10 or 15%,” he explained. Despite potential short-term setbacks, Scaramucci emphasized the underlying demand dynamics bolstering Bitcoin’s price, particularly highlighting the influence of new financial products like ETFs and the growing interest from institutional investors.
He elaborated on his bullish outlook, linking it to the anticipated Bitcoin halving, an event that historically impacts the supply side of Bitcoin economics by reducing the reward for mining new blocks, thereby constraining supply. “But long term with the halving coming this week, I think this thing trades to $ 170,000, possibly to $ 200,000,” Scaramucci asserted.
The discussion also veered into the broader implications of Bitcoin’s integration into traditional financial products, such as ETFs. Scaramucci argued that these instruments play a critical role in broadening Bitcoin’s investor base.
He dismissed concerns over the potential for ETFs to lead to centralization of Bitcoin ownership. “In terms of adoption vis-a-vis the ETF, you look out your four-year time horizon. […] It will still be less than 10 % of the overall ownership of Bitcoin. So this whole notion that the ETFs are gonna overly centralize Bitcoin, I don’t buy it. I think what the ETFs are, though, is they’re a great conduit for people that are used to buying them.”
BTC Is Still In The Web 1.0 Era
Scaramucci compared Bitcoin’s trajectory to the early internet era, particularly drawing parallels with significant tech stocks like Amazon during the dot-com bubble. “In 1999, Amazon was an emerging stock on an emerging technology, and it was quite volatile. And you lost 20 to 50 % eight times on Amazon. You lost 80%. Yeah, that one time in March of 2020, it went down 80%. But if you held Amazon over that period of time, $ 10,000 is worth a little over $ 14 million today.”
He also addressed concerns about Bitcoin’s practical uses, contrasting its current utility with more traditional assets like gold, which also do not offer direct cash flow. Scaramucci highlighted innovative financial practices within the crypto ecosystem that provide returns similar to traditional cash flow, such as yield-generating accounts and borrowing agreements available through platforms like Galaxy Digital.
Regarding potential market downturns akin to the dot-com bust, Scaramucci acknowledged the risks but remained optimistic about Bitcoin’s resilience and long-term value proposition. “I think if we go through a dot-com bust in the broader market in the next year or two, I think you’ll have a price shock in Bitcoin consistent with a dot-com bust. However, if you’re willing to hold that asset, which we are over a rolling four-year period of time, no one has ever lost money in Bitcoin,” he noted, underscoring the importance of a long-term investment horizon.
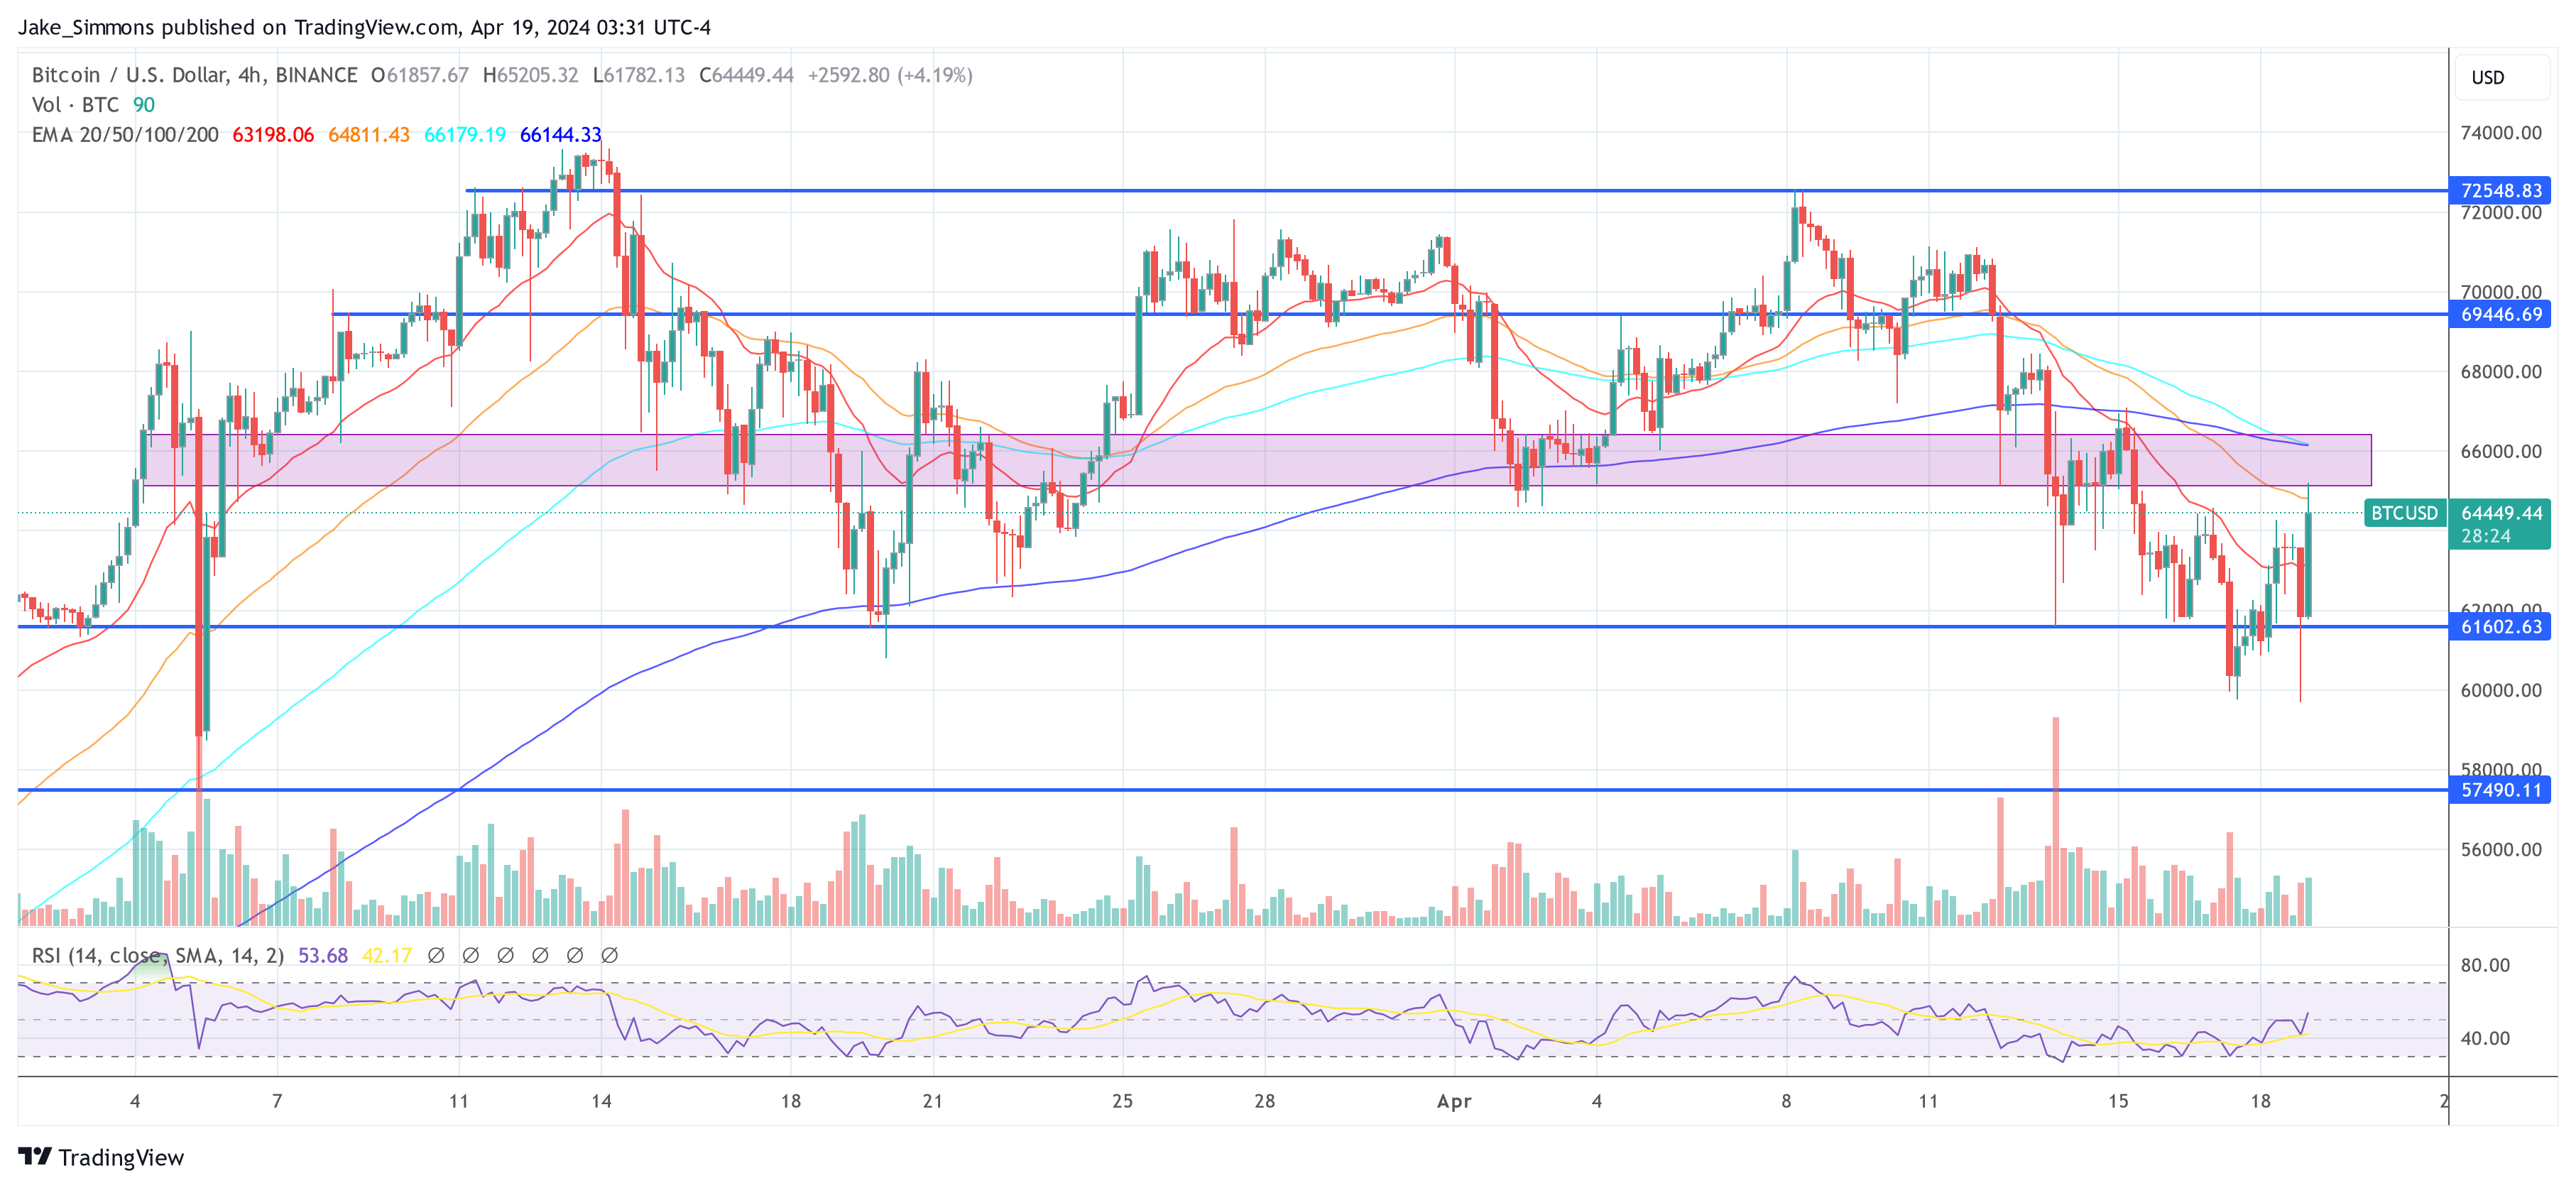
At press time, the BTC price rallied back above $ 64,000.
No Fed Rate Cuts? No Worries For Bitcoin, Says Research Firm
As the US economy grapples with rising inflation expectations and scaled-back forecasts for Federal Reserve rate cuts, the Bitcoin market remains buoyant, according to a detailed analysis by Reflexivity Research. With the US CPI headline inflation projected to accelerate to 4.8% by the November 2024 elections, according to Bank of America, conditions are seemingly unfavorable for a loosening of monetary policy. Despite this, the cryptocurrency sector, particularly Bitcoin, appears insulated and optimistic.
Bitcoin Unfazed By Delayed Rate Cuts?
The bond market now anticipates only three Federal Reserve rate cuts this year, a significant reduction from the earlier forecast of six. The CME FedWatch tool indicates that the majority of market participants do not expect a rate cut to occur before the mid-September FOMC meeting. This adjustment reflects a recalibration of expectations regarding the Fed’s capacity to manage persistent inflation pressures.
Amidst these macroeconomic shifts, Ritik Goyal, in a guest post for Reflexivity Research, presents a compelling analysis in his report titled “The Fed is Unable to Cause a Recession. Risk Assets are Yet to Realize This.”
The report argues that, contrary to conventional wisdom, the Federal Reserve’s rate hikes have had unintended stimulative effects on the economy. Goyal elucidates three specific mechanisms through which this phenomenon operates:
1. Increased Government Interest Payments: “Rate hikes raised interest payments by the government to the private sector,” Goyal notes. As the Fed raises rates, it increases the interest burden on the government, which has borrowed extensively during the post-COVID period. With the federal debt-to-GDP ratio exceeding 120%, the doubled interest payments now effectively act as a stimulus, channeling approximately $ 1 trillion annually to the private sector
2. Direct Subsidy to Banking System: The Fed’s policy adjustments have also led to a redistribution of wealth within the financial system. “Rate hikes raised the Fed’s direct subsidy to the banking system,” states Goyal. This has occurred as the yield curve inversion resulted in the Fed incurring losses on its balance sheet, losses that directly benefit the banking sector, translating to an estimated $ 150 billion annual subsidy.
3. Induced Housing Construction Boom: The rate hikes have paradoxically stimulated the housing market. “Rate hikes induced a housing construction boom,” according to Goyal. As higher rates discourage existing homeowners from selling, the only viable option to meet housing demand is new construction, a sector with one of the highest GDP multipliers.
Goyal’s insights underline a critical misalignment in the Fed’s current approach against the backdrop of substantial fiscal interventions since the pandemic. “The traditional monetary policy framework is breaking down under the weight of fiscal dominance,” Goyal concludes, suggesting an environment that could favor non-traditional assets like Bitcoin.
Echoing Goyal’s findings, crypto expert Will Clemente highlighted the broader implications for cryptocurrencies on X (formerly Twitter), stating, “With debt/GDP as high as it is, we’re in a backwards world where high rates mean interest payments on debt are stimmy checks for people that buy assets—~$ 1T will be paid out in 2024. Big picture is very constructive for the internet coins.”
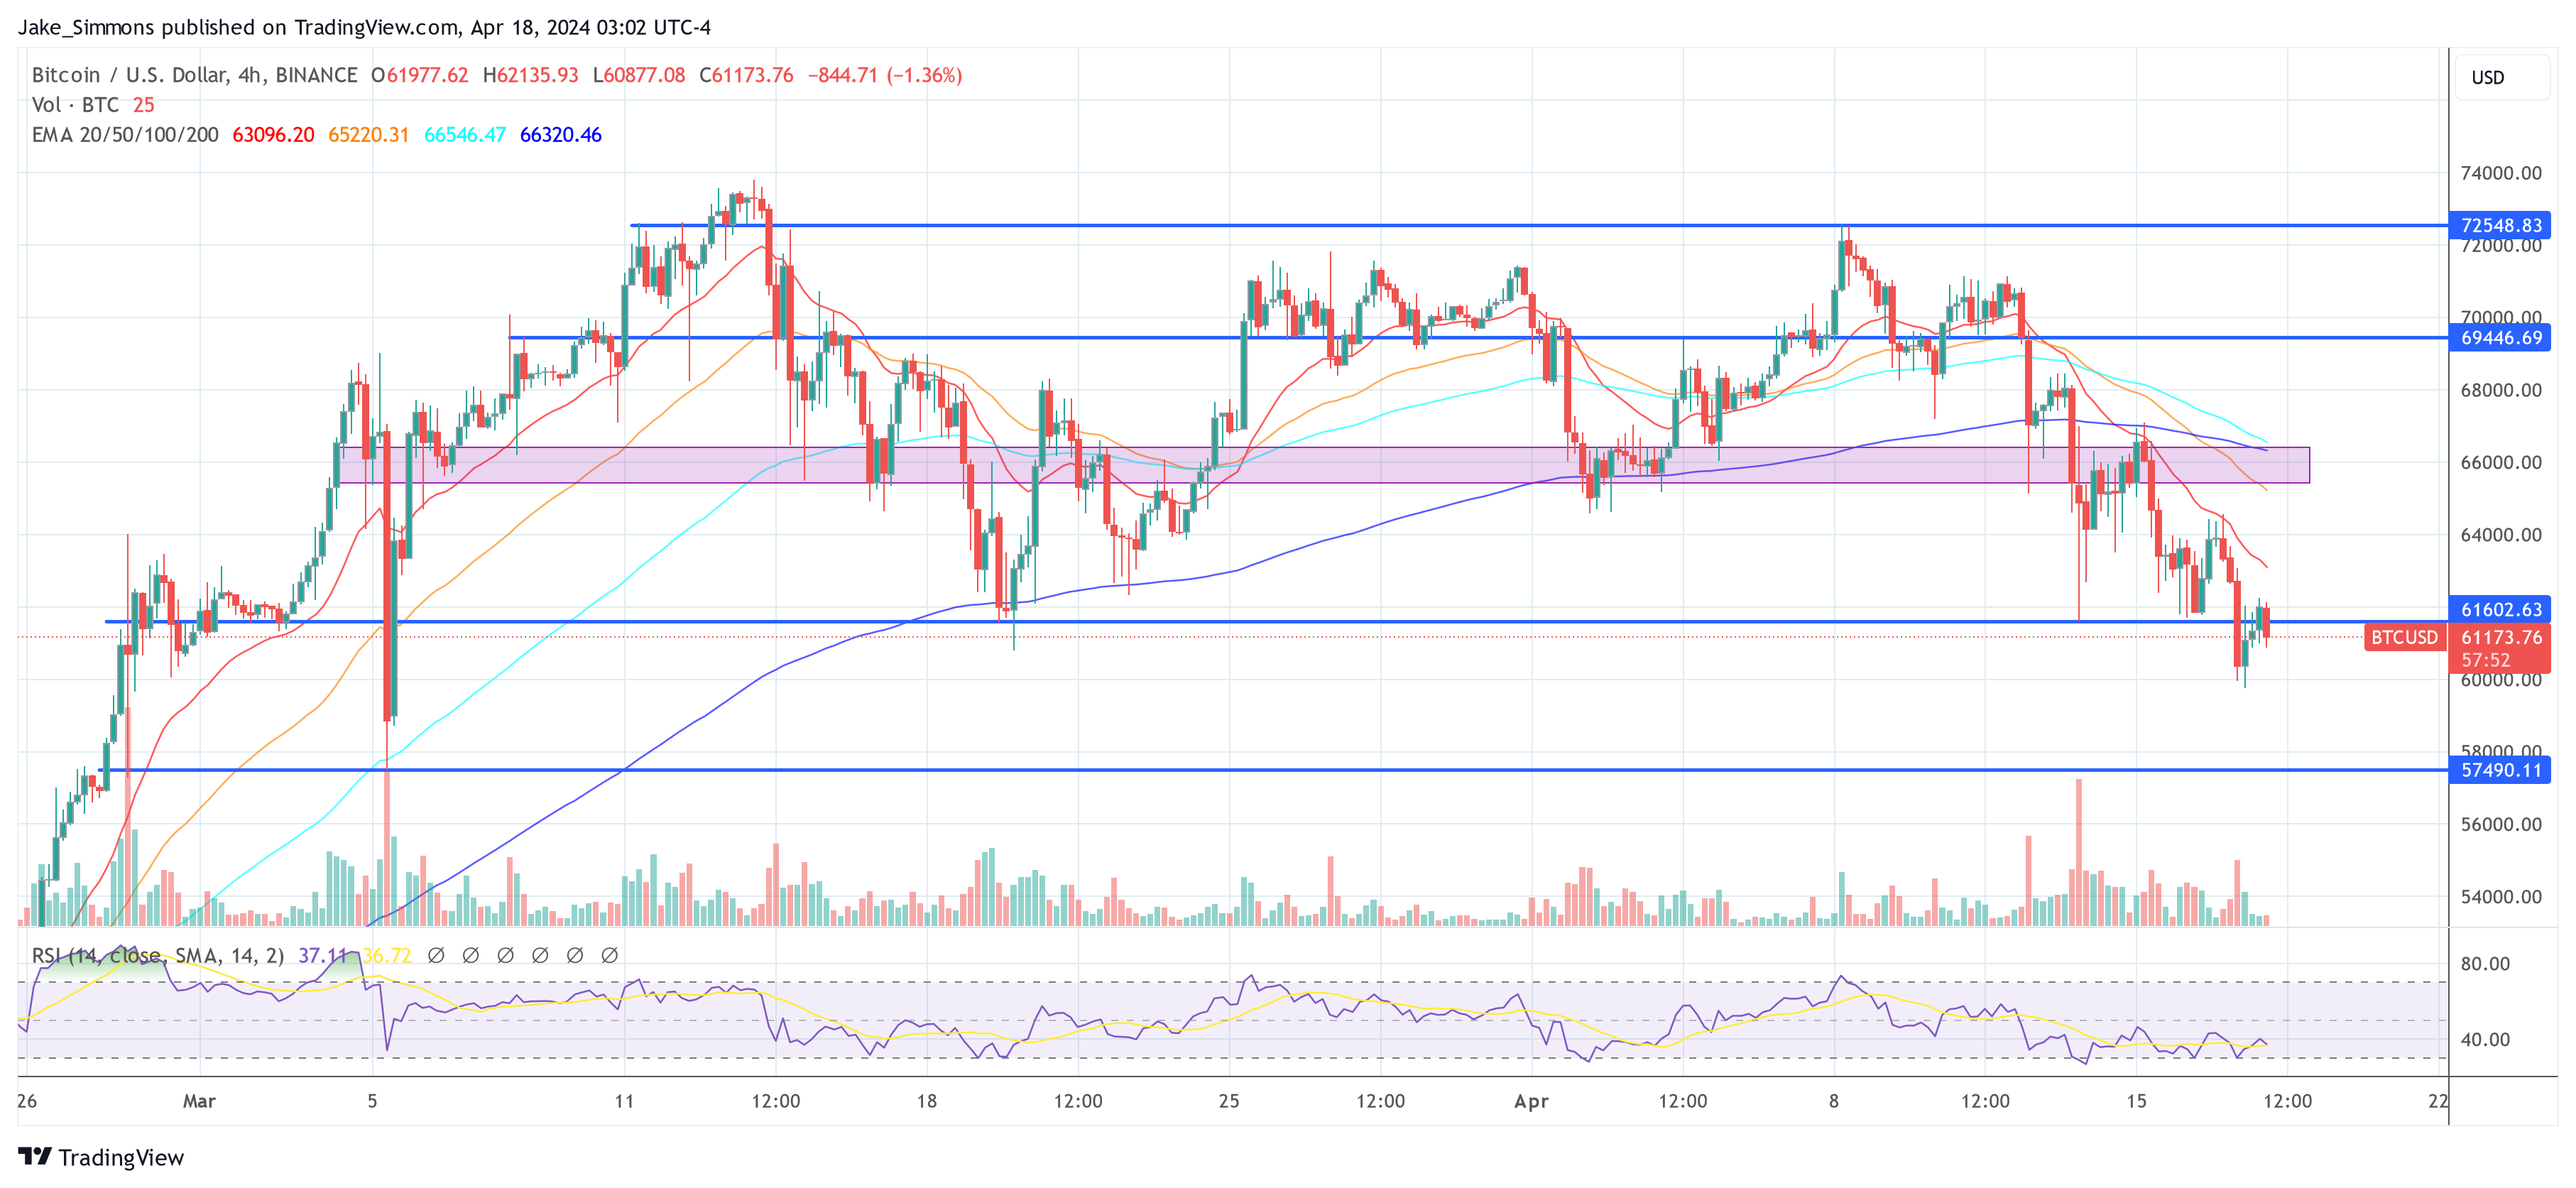
At press time, BTC traded at $ 61,173.
Cardano’s Dark Hour: Panic Grips Investors As ADA Loses 22% Of Its Value

As the cryptocurrency market experiences heightened volatility, one digital asset, in particular, finds itself under the microscope: Cardano (ADA).
At the time of writing, ADA was trading at $ 0.45, down 1.8% and 21.9% in daily and weekly timeframes, data from Coingecko shows.
With prices fluctuating and investors on edge, analysts are closely scrutinizing ADA’s movements for signs of stability or further turbulence.
Analysis Points To Critical Crossroads For Cardano
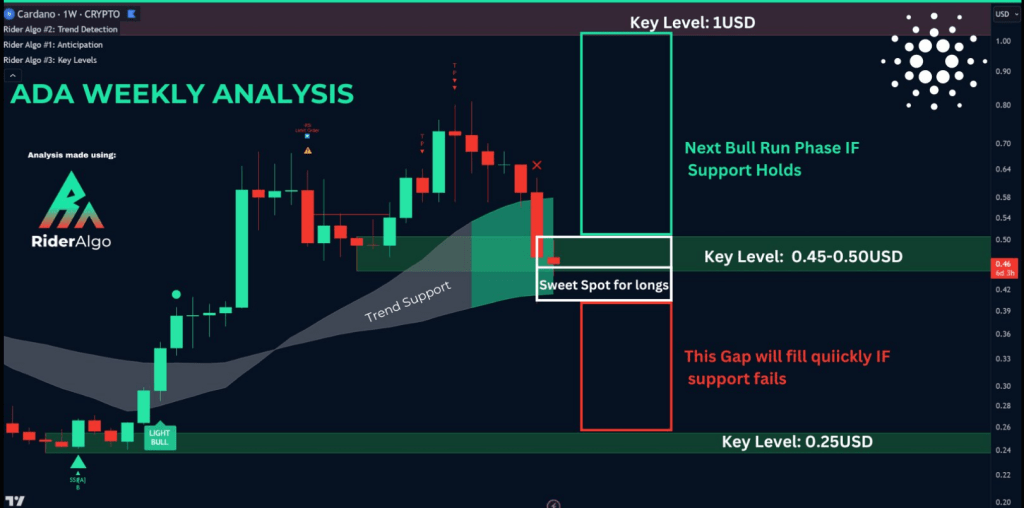
Recent analysis conducted by Trend Rider, a respected voice in the crypto community, suggests that Cardano’s price has reached a pivotal moment. The digital asset stands at a critical juncture, with its price hovering precariously near a key support zone.
Should ADA breach this support level, analysts warn of a potential plunge to $ 0.25. However, if Cardano manages to hold this level, it could signal the formation of a double bottom, potentially paving the way for a rally towards the $ 1 mark.
#ADA has taken a hit and panic is setting in.
But is this truly the end?
I’ve gathered crucial insights.
Let’s demystify the chaos with facts.
A must read, short thread
pic.twitter.com/gYWHPHmylk
— Trend Rider (@TrendRidersTR) April 15, 2024
Amidst this uncertainty, the fate of Cardano appears intricately linked to the movements of Bitcoin, the dominant force in the cryptocurrency market.
Bitcoin’s Influence On ADA Trajectory
As Bitcoin charts its own course, Cardano investors are keenly aware of the impact that the flagship cryptocurrency’s movements can have on ADA’s price action.
Should Bitcoin embark on a bullish trajectory, it could trigger a sharp decline in altcoins like Cardano, followed by a swift rebound.
Conversely, a bearish path for Bitcoin could spell an extended period of bearish sentiment for the broader crypto market, including Cardano. Despite the uncertainty surrounding Cardano’s future, Trend Rider advises investors to remain calm and adhere to their investment strategies.
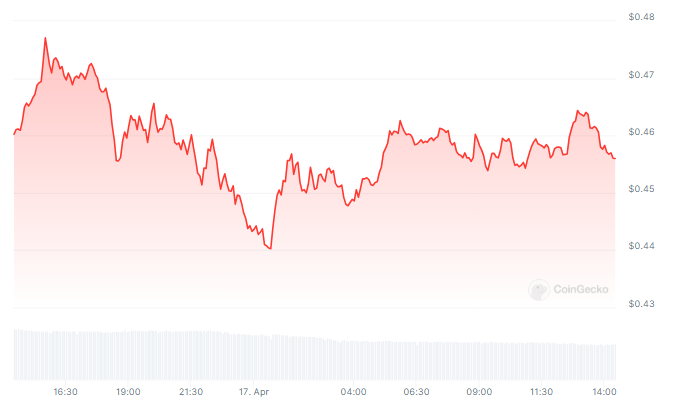
In addition to providing guidance for navigating the current market conditions, Trend Rider draws parallels between Cardano’s present situation and its historical performance.
Historical Comparisons Offer Hope Amidst Uncertainty
Drawing from history, Trend Rider points to Cardano’s resilience in the face of adversity. In October 2020, ADA experienced a significant drop in value, plummeting to a mere $ 0.10 before staging an impressive comeback, reaching a valuation of slightly over $ 3.
This historical precedent serves as a reminder that Cardano has weathered storms before, and may be poised for a similar resurgence in the face of adversity.
As fear levels peak amidst Cardano’s testing of major support thresholds, investors are reminded of the importance of maintaining a steady hand and a long-term perspective.
Featured image from Pexels, chart from TradingView
Bitcoin Price Gearing For Another Lift-Off to $72.5K: Dips Turn Attractive
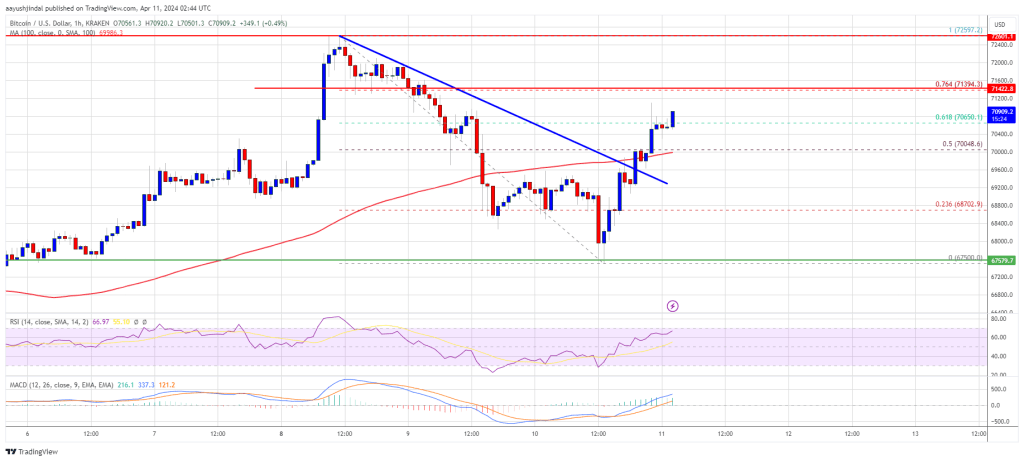
Bitcoin price found support near $ 67,500. BTC started a fresh increase and might soon revisit the $ 72,500 resistance zone in the near term.
- Bitcoin retested the $ 67,500 support zone before it started a fresh increase.
- The price is trading above $ 70,000 and the 100 hourly Simple moving average.
- There was a break above a key bearish trend line with resistance at $ 69,600 on the hourly chart of the BTC/USD pair (data feed from Kraken).
- The pair could gain bullish momentum if it clears the $ 71,400 resistance zone.
Bitcoin Price Holds Support
Bitcoin price saw another decline below the $ 70,000 zone. BTC even dived below the $ 68,500 level after the US CPI increased more than expected. However, the bulls were active near the $ 67,500 support.
A low was formed at $ 67,500 and the price started a fresh increase. There was a move above the $ 69,200 and $ 69,500 resistance levels. The price cleared the 50% Fib retracement level of the downward move from the $ 72,597 swing high to the $ 67,500 low.
There was a break above a key bearish trend line with resistance at $ 69,600 on the hourly chart of the BTC/USD pair. Bitcoin is now trading above $ 70,000 and the 100 hourly Simple moving average.
Immediate resistance is near the $ 71,400 level or the 76.4% Fib retracement level of the downward move from the $ 72,597 swing high to the $ 67,500 low. The first major resistance could be $ 72,500. The next resistance now sits at $ 72,800. If there is a clear move above the $ 72,800 resistance zone, the price could continue to move up.
Source: BTCUSD on TradingView.com
In the stated case, the price could rise toward $ 73,200. The next major resistance is near the $ 73,500 zone. Any more gains might send Bitcoin toward the $ 75,000 resistance zone in the near term.
Another Decline In BTC?
If Bitcoin fails to rise above the $ 71,400 resistance zone, it could start another decline. Immediate support on the downside is near the $ 70,000 level and the 100 hourly SMA.
The first major support is $ 69,200. If there is a close below $ 69,200, the price could start a drop toward the $ 68,500 level. Any more losses might send the price toward the $ 67,500 support zone in the near term.
Technical indicators:
Hourly MACD – The MACD is now gaining pace in the bullish zone.
Hourly RSI (Relative Strength Index) – The RSI for BTC/USD is now above the 50 level.
Major Support Levels – $ 70,000, followed by $ 69,200.
Major Resistance Levels – $ 71,400, $ 72,500, and $ 73,500.
Forget Q1 Slump: Solana Explodes Over 300% Amid DEX Boom

In the first quarter of 2024, Solana became the clear leader thanks to a notable increase in the amount of Decentralized Exchange (DEX) and Decentralized Finance (DeFi).
In addition to its remarkable rise in DEX and DeFi sectors, Solana’s dominance was further solidified by its scalability, low transaction fees, and robust infrastructure.
The massive increase in DEX volume signifies a substantial rise in trading activity within the SOL ecosystem. This trend aligns with the broader adoption of DeFi, with Solana establishing itself as a major player in the space.
This remarkable increase is described in detail in a new report titled “State of Solana Q1 2024” by on-chain analytics company Messari.
The research states that throughout the last three months, The altcoin’s average daily spot DEX volume increased by over 300% to $ 1.5 billion.
Solana DEX Volume Skyrockets
Solana’s DeFi total value locked, a metric that represents the total value of cryptocurrency locked within DeFi protocols on a blockchain, surged by over 200% to nearly $ 5 billion, placing it fourth among all networks. This indicates a growing appetite from investors for DeFi projects built on Solana.
.@solana has become the home for retail users.
QoQ Metrics – DEX Volume
332% – Revenue
597% – Total raised in ecosystem
51% – Market cap
97%
Check out the full Q1 report by @ph0rt0n
https://t.co/hYA1d2ZPY6 pic.twitter.com/egpv6U9Rl8
— Messari (@MessariCrypto) April 5, 2024
Stablecoin Adoption On Solana On The Rise
Another bright spot for Solana in Q1 was the significant growth in its stablecoin market capitalization, which jumped by 50% to nearly $ 3 billion. This surge was primarily driven by USDC, the leading stablecoin, whose market capitalization on Solana increased by an impressive 110% to slightly above $ 2 billion.
This growth reflects a rise in trust and adoption of stablecoins on the Solana blockchain, which are cryptocurrencies pegged to the value of traditional assets like the US dollar, offering stability in a volatile market.
Solana Price Volatility A Concern
Despite the positive indicators, the report also acknowledges some potential drawbacks. While the high trading volume is a positive sign, the fact that meme coins are a major contributor raises questions about the long-term sustainability of this growth.
Meme coins are often known for their erratic price movements and lack of underlying utility. Their dominance in Solana’s DEX volume might indicate a speculative bubble rather than genuine growth based on solid projects.
At the time of writing, SOL was trading at $ 174, reflecting a 12% decrease in the last seven days. This price volatility is a common concern in the cryptocurrency market, and Solana is not immune to it.
Featured image from Pixabay, chart from TradingView

