
XRP Price Softens — Momentum Weakness Could Limit Upside In Near Term
XRP price started a fresh increase above $ 2.550. The price is now facing hurdles above $ 2.650 and at risk of another decline in the near term.
- XRP price gained pace for a move above $ 2.60 and $ 2.620 before the bears appeared.
- The price is now trading below $ 2.60 and the 100-hourly Simple Moving Average.
- There was a break below a bullish trend line with support at $ 2.6350 on the hourly chart of the XRP/USD pair (data source from Kraken).
- The pair could start a fresh increase if it stays above $ 2.50.
XRP Price Retreats Lower
XRP price started a fresh increase after it settled above $ 2.50, like Bitcoin and Ethereum. The price surpassed the $ 2.550 and $ 2.60 resistance levels.
The bulls were able to push the price above $ 2.650. A high was formed at $ 2.6972 and the price recently started a downside correction. There was a move below the 23.6% Fib retracement level of the recent move from the $ 2.327 swing low to the $ 2.6972 high.
Besides, there was a break below a bullish trend line with support at $ 2.6350 on the hourly chart of the XRP/USD pair. The price is now trading below $ 2.60 and the 100-hourly Simple Moving Average.
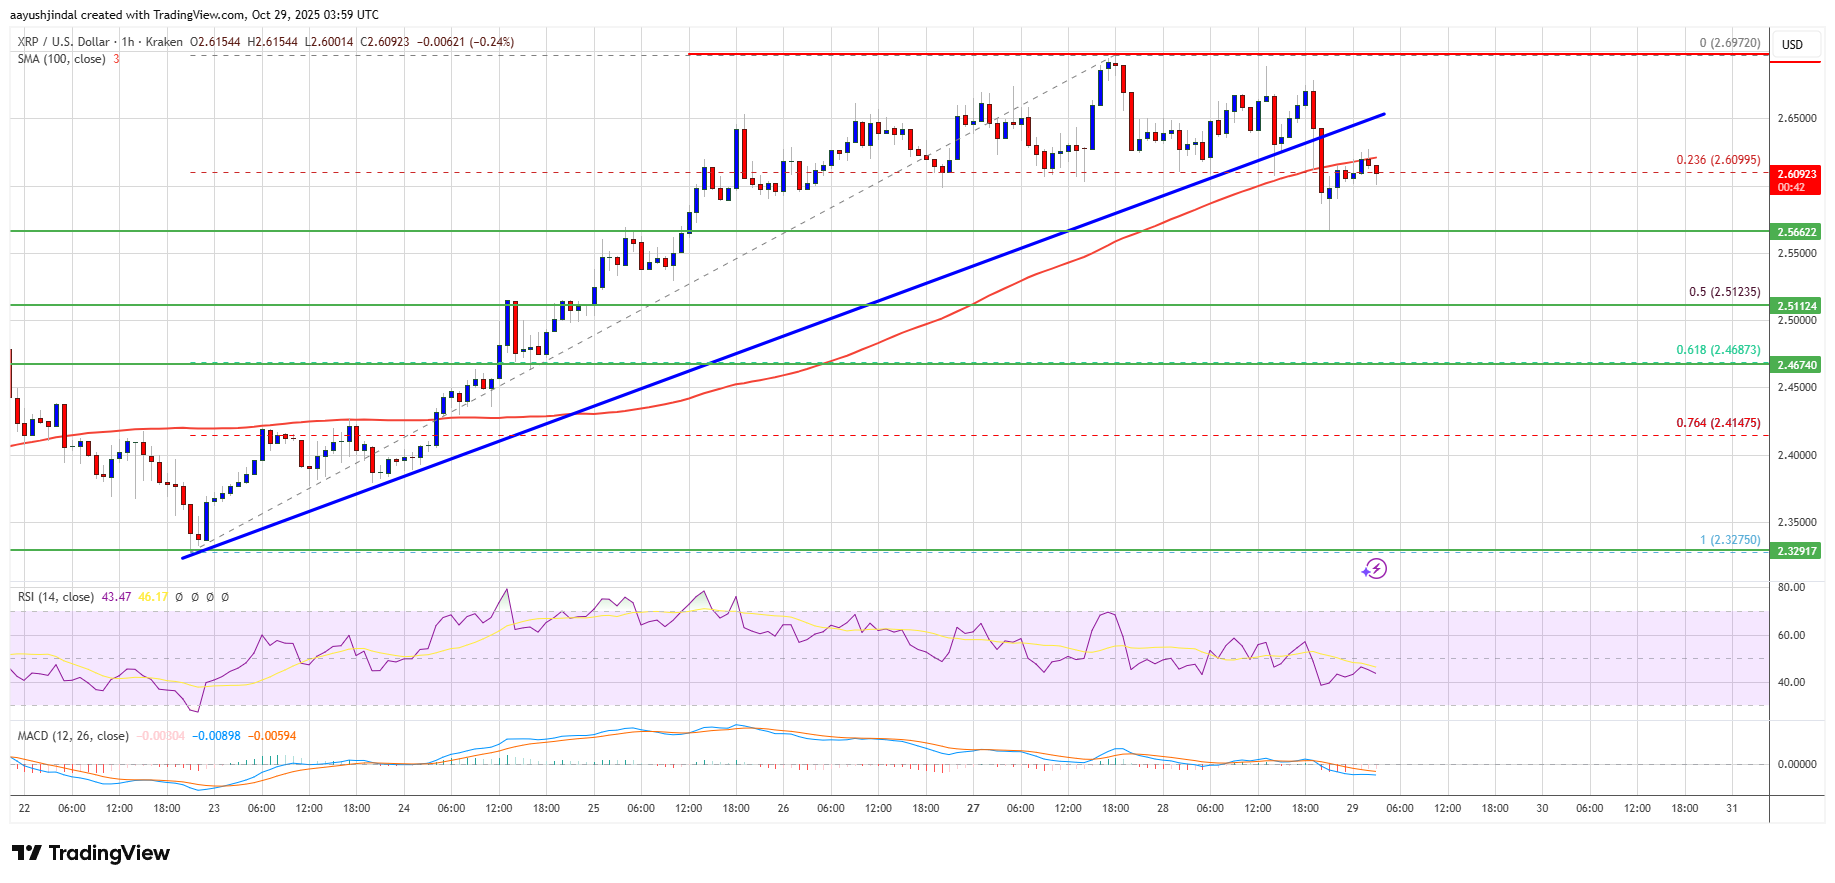
If there is a fresh upward move, the price might face resistance near the $ 2.620 level. The first major resistance is near the $ 2.650 level, above which the price could rise and test $ 2.6880. A clear move above the $ 2.6880 resistance might send the price toward the $ 2.720 resistance. Any more gains might send the price toward the $ 2.7650 resistance. The next major hurdle for the bulls might be near $ 2.80.
More Losses?
If XRP fails to clear the $ 2.650 resistance zone, it could start a fresh decline. Initial support on the downside is near the $ 2.5650 level. The next major support is near the $ 2.550 level.
If there is a downside break and a close below the $ 2.550 level, the price might continue to decline toward $ 2.5120 or the 50% Fib retracement level of the recent move from the $ 2.327 swing low to the $ 2.6972 high. The next major support sits near the $ 2.450 zone, below which the price could continue lower toward $ 2.40.
Technical Indicators
Hourly MACD – The MACD for XRP/USD is now gaining pace in the bearish zone.
Hourly RSI (Relative Strength Index) – The RSI for XRP/USD is now below the 50 level.
Major Support Levels – $ 2.550 and $ 2.5120.
Major Resistance Levels – $ 2.650 and $ 2.6880.