
TA: Bitcoin Extends Rally, Why Bulls Remain In The Driver’s Seat
Bitcoin price rallied over 6% and it broke the $ 17,500 resistance against the US Dollar. BTC is consolidating gains and it seems like the bulls are aiming more upsides above $ 18,000.
- Bitcoin extended its rise above the $ 17,200 and $ 17,500 resistance levels.
- The price traded to a new monthly high at $ 17,895 and settled above the 100 hourly simple moving average.
- There is a key contracting triangle forming with resistance near $ 17,800 on the hourly chart of the BTC/USD pair (data feed from Kraken).
- The pair remains well supported and it is likely to rally further above the $ 18,000 resistance.
Bitcoin Price Gains 6%
After a sharp rise above the $ 17,000 resistance, bitcoin price started following a bullish path. BTC even surged above the $ 17,200 level to move further into a positive zone.
The price rallied over 6%, broke the $ 17,500 resistance, and settled well above the 100 hourly simple moving average. Bitcoin traded to a new monthly high at $ 17,895 and it is currently consolidating gains.
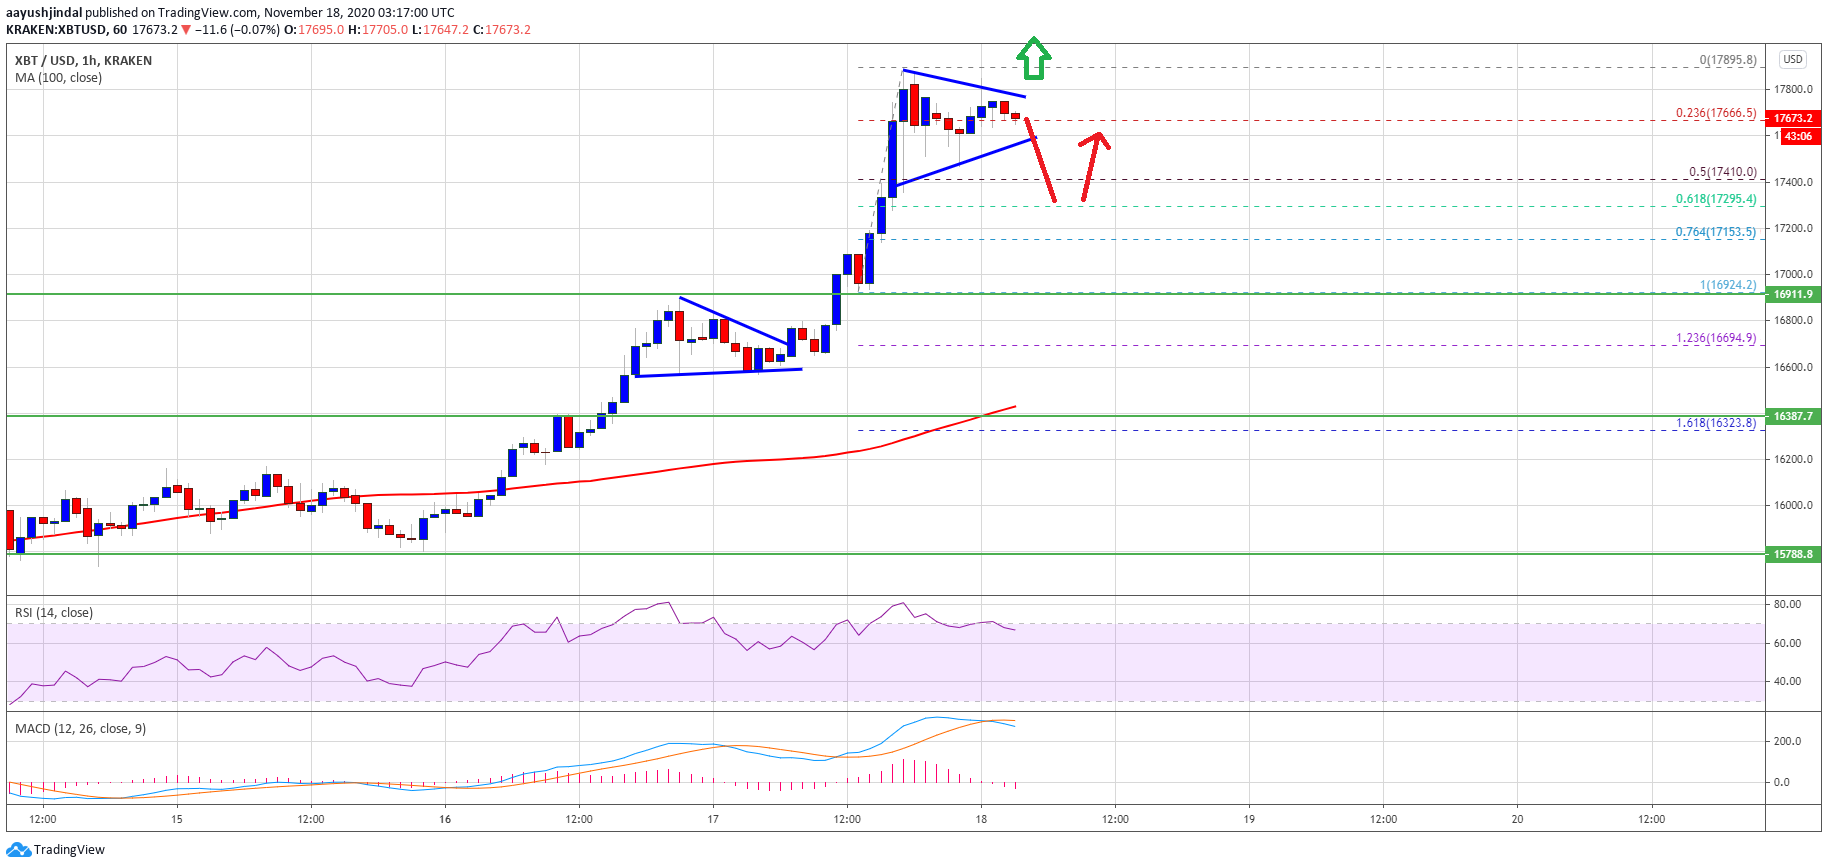
Source: BTCUSD on TradingView.com
It corrected below the 23.6% Fib retracement level of the recent surge from the $ 16,924 swing low to $ 17,895 high. However, the price remained well supported above the $ 17,500 level. It seems like there is a key contracting triangle forming with resistance near $ 17,800 on the hourly chart of the BTC/USD pair.
If there is a fresh break above the triangle resistance at $ 17,800, the price could rally further. The next major resistance is near the $ 18,000 level. Any further gains could open the doors for a rise towards the $ 18,400 level in the near term. An intermediate resistance sits near the $ 18,250 level.
Dips Supported in BTC?
If bitcoin fails to clear the triangle resistance or $ 17,850, there could be a short-term downside correction. An initial support is near the triangle support at $ 17,580.
The next major support is near the $ 17,410 level. It is close to the 50% Fib retracement level of the recent surge from the $ 16,924 swing low to $ 17,895 high. Any further losses may perhaps lead the price towards the $ 17,200 support level.
Technical indicators:
Hourly MACD – The MACD is slowly losing momentum in the bullish zone.
Hourly RSI (Relative Strength Index) – The RSI for BTC/USD is currently correcting lower, but it is well above the 60 level.
Major Support Levels – $ 17,580, followed by $ 17,400.
Major Resistance Levels – $ 17,800, $ 17,850 and $ 18,000.