
Charted: Ripple (XRP) Could Rally Significantly If It Clears This Key Resistance
Ripple formed a support base above $ 1.16 and it is now rising against the US Dollar. XRP price could start a strong increase if it clears the main $ 1.50 resistance zone.
- Ripple is showing positive signs above the $ 1.20 and $ 1.30 resistance levels against the US dollar.
- The price is now trading well above $ 1.3500 and the 100 simple moving average (4-hours).
- There is a major contracting triangle forming with resistance near $ 1.50 on the 4-hours chart of the XRP/USD pair (data source from Kraken).
- The pair is likely to start a fresh rally if it clears the $ 1.500 resistance zone.
Ripple’s XRP Price Eyes Fresh Rally
This past week, ripple’s XRP started a downside correction from well above $ 1.65. XRP extended its decline below the key $ 1.50 support, similar to bitcoin and ethereum.
It opened the doors for a nasty spike below the $ 1.20 support. However, the bulls were active above the $ 1.15 level. A low is formed near $ 1.162 and the price is now rising. It broke the $ 1.25 and $ 1.30 resistance levels.
There was a break above the 23.6% Fib retracement level of the downward move from the $ 1.97 high to $ 1.162 swing low. It is now trading well above $ 1.3500 and the 100 simple moving average (4-hours). There is also a major contracting triangle forming with resistance near $ 1.50 on the 4-hours chart of the XRP/USD pair.
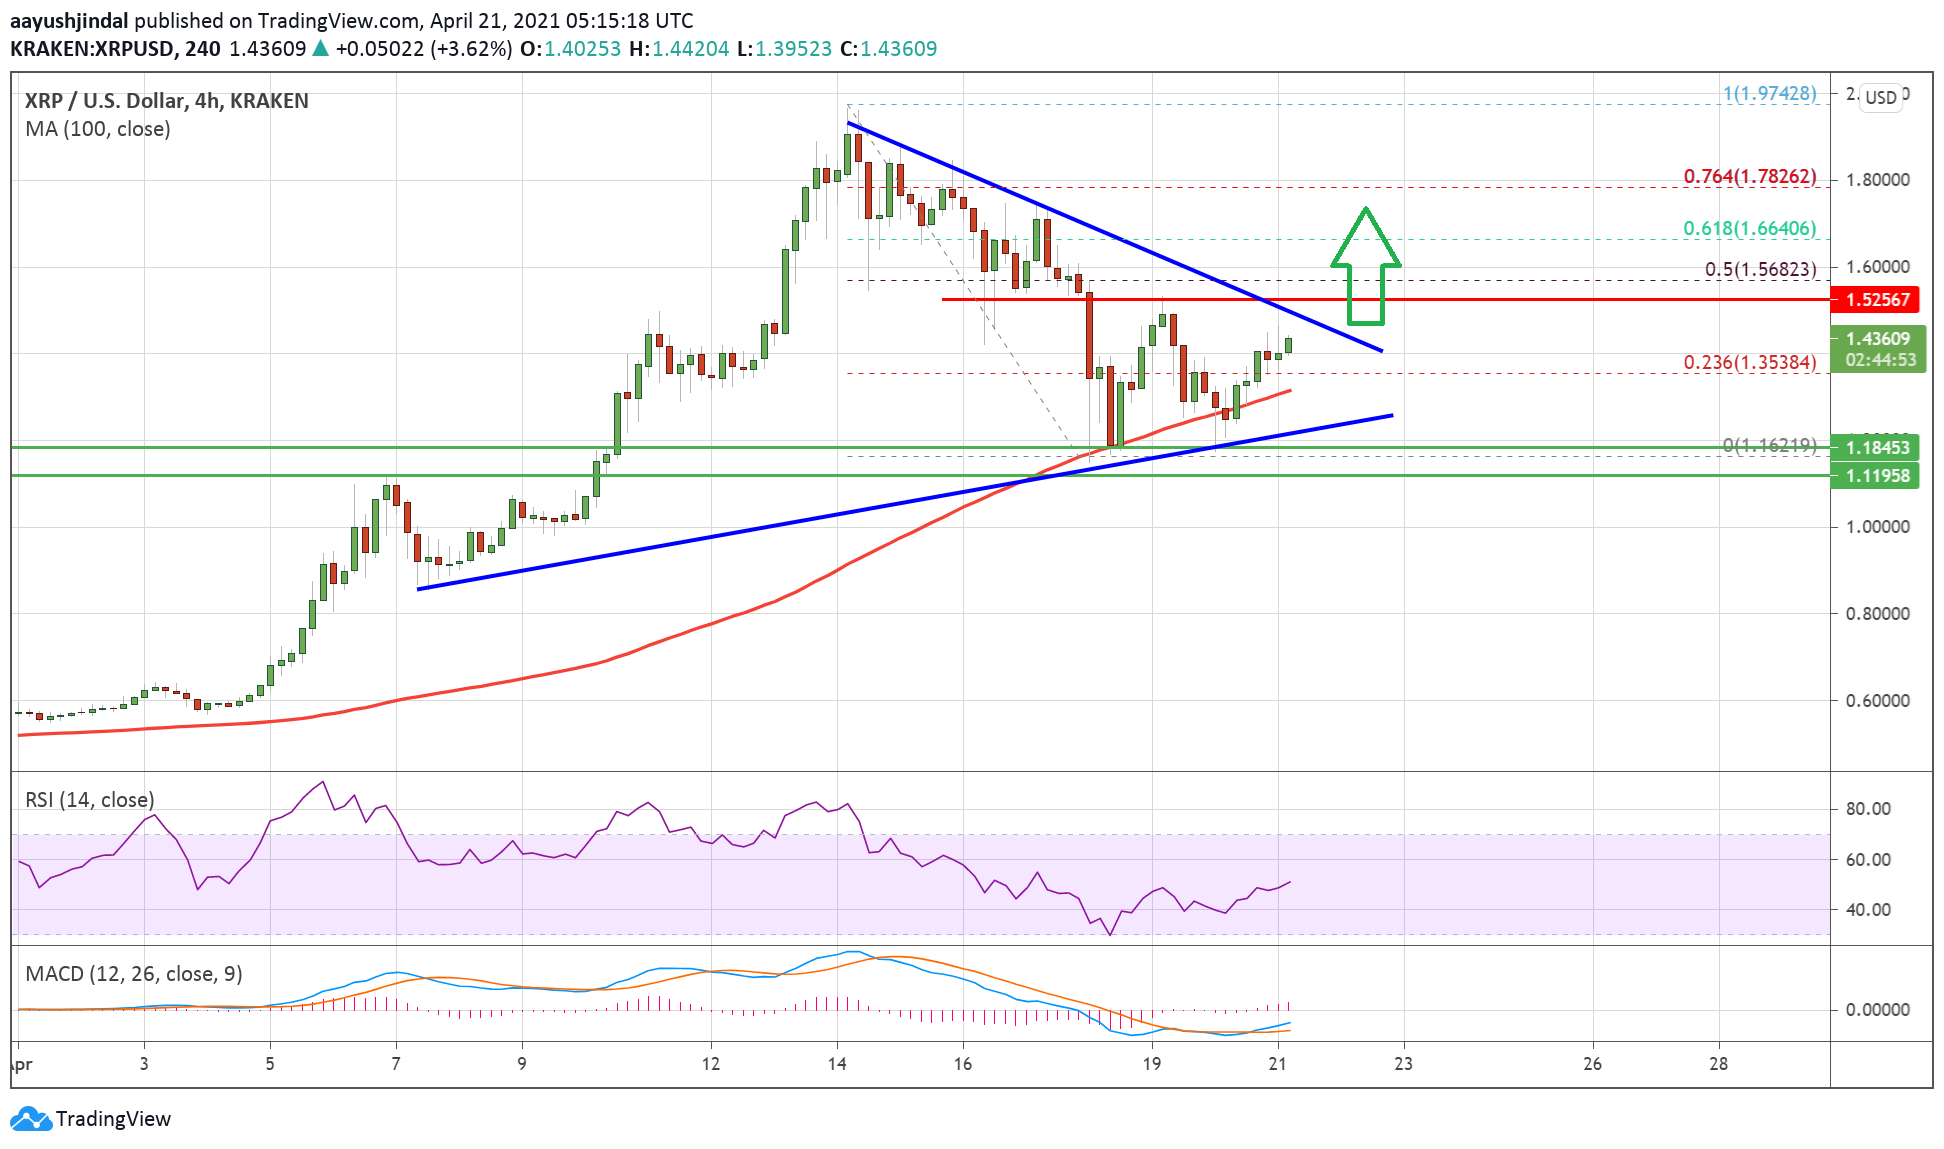
Source: XRPUSD on TradingView.com
The triangle resistance near $ 1.50 holds the key. The next hurdle could be $ 1.56. It is near the 50% Fib retracement level of the downward move from the $ 1.97 high to $ 1.162 swing low.
A successful break above the triangle resistance and then $ 1.56 could set the pace for a fresh surge. In this case, the price could even rally above the $ 1.65 and $ 1.70 levels.
Dips Limited in XRP?
If ripple fails to clear the $ 1.5000 resistance or $ 1.560, it could correct further lower. An initial support on the downside is near the $ 1.3200 level and the 100 SMA.
The next major support is near the $ 1.28 level and the triangle lower trend line. Any more losses might call for a drop towards the $ 1.15 support zone in the coming sessions.
Technical Indicators
4-Hours MACD – The MACD for XRP/USD is slowly gaining pace in the bullish zone.
4-Hours RSI (Relative Strength Index) – The RSI for XRP/USD is now above the 50 level.
Major Support Levels – $ 1.32, $ 1.28 and $ 1.15.
Major Resistance Levels – $ 1.50, $ 1.56 and $ 1.65.