
TA: Ethereum Loses Steam, Why 100 SMA Is The Key For More Gains
Ethereum was able to clear the $ 1,700 resistance against the US Dollar. ETH failed to stay above $ 1,700 and is currently struggling to continue higher.
- Ethereum was able to slowly move higher above $ 1,650 and $ 1,700.
- The price is now trading above $ 1,655 and the 100 hourly simple moving average.
- There is a crucial rising channel forming with support near $ 1,670 on the hourly chart of ETH/USD (data feed via Kraken).
- The pair could continue to move up if it stays above the $ 1,655 support zone.
Ethereum Price Tops Near $ 1,700
Ethereum started an upside correction above the $ 1,650 resistance zone. ETH climbed above the $ 1,660 and $ 1,675 levels to move into a short-term positive zone.
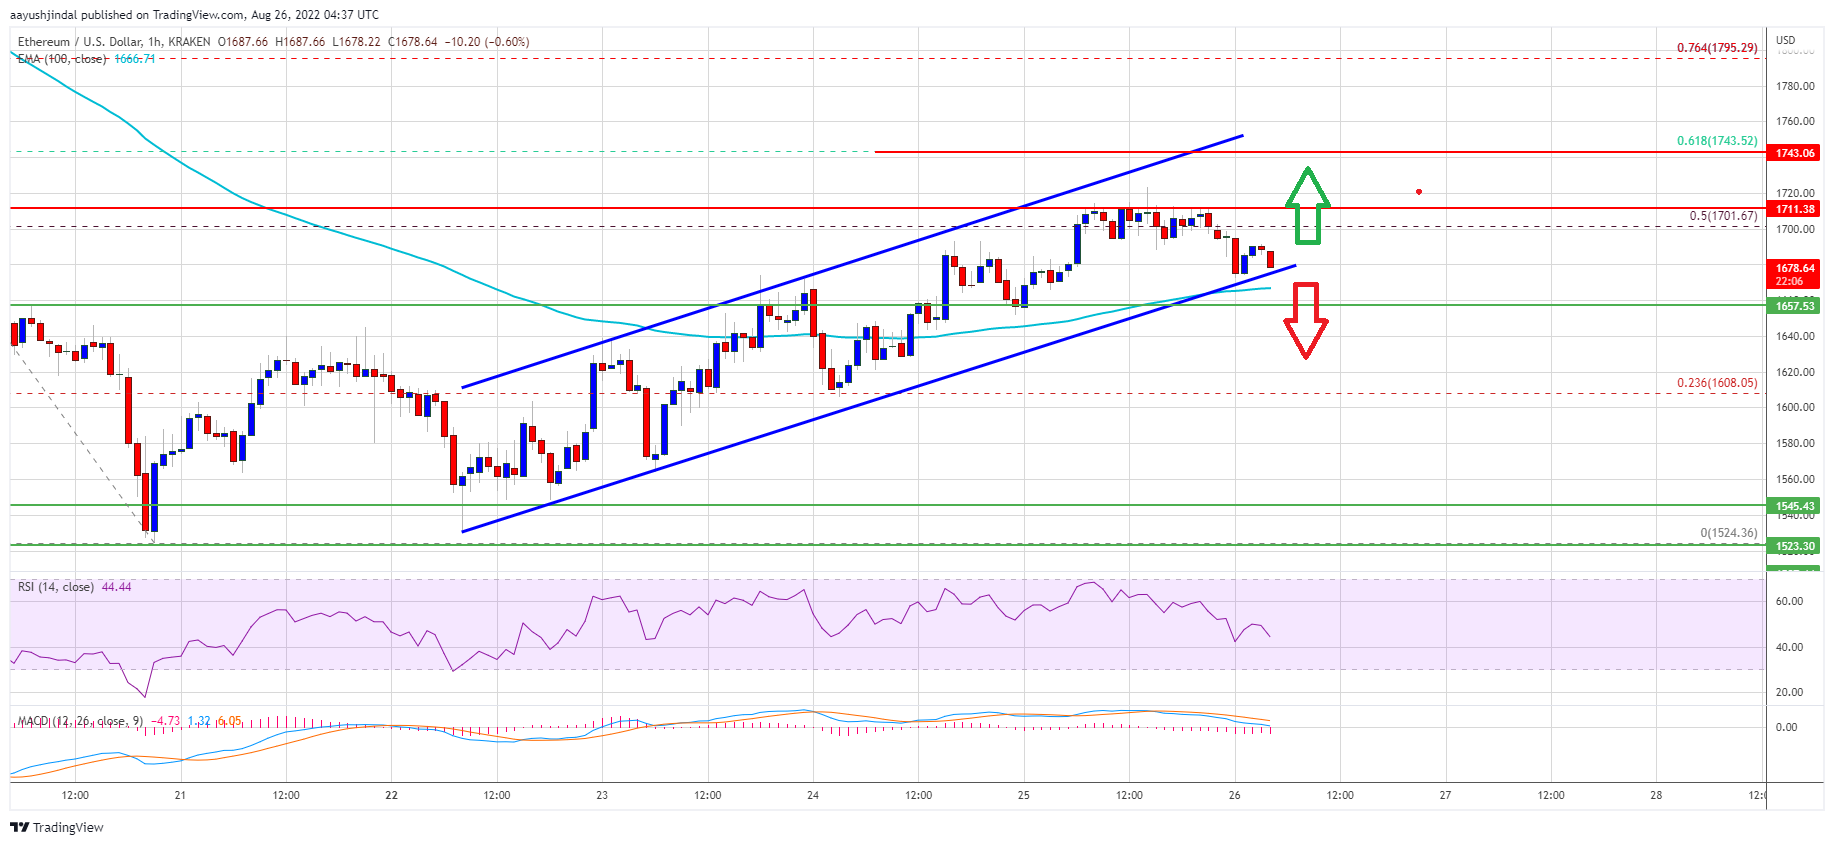
There was a spike above the $ 1,700 level and a close above the 100 hourly simple moving average. Ether price even moved a few points above the 50% Fib retracement level of the key decline from the $ 1,880 swing high to $ 1,525 low.
However, the bulls failed to stay above the $ 1,700 resistance zone. It is now moving lower below $ 1,680. There is also a crucial rising channel forming with support near $ 1,670 on the hourly chart of ETH/USD.
An immediate resistance on the upside is near the $ 1,700 level. The first major resistance is now forming near the $ 1,720 level. The next major resistance is near the $ 1,745 level. It is near the 61.8% Fib retracement level of the key decline from the $ 1,880 swing high to $ 1,525 low.
Source: ETHUSD on TradingView.com
A clear move above the $ 1,745 level might send the price towards $ 1,800 resistance. Any more gains may perhaps open the doors for a test of the $ 1,850 resistance.
Fresh Decline in ETH?
If ethereum fails to rise above the $ 1,720 resistance, it could start a fresh decline. An initial support on the downside is near the $ 1,670 zone and the channel trend line.
The next major support is near $ 1,655 and the 100 hourly simple moving average, below which ether price might accelerate lower. In the stated case, the price may perhaps decline towards the $ 1,600 level. Any more losses may perhaps send the price towards the $ 1,550 level.
Technical Indicators
Hourly MACD – The MACD for ETH/USD is now losing momentum in the bullish zone.
Hourly RSI – The RSI for ETH/USD is now below the 50 level.
Major Support Level – $ 1,655
Major Resistance Level – $ 1,720