
Bitcoin Price Dips Again As The Bulls Struggle To Push It To $30K
Bitcoin price is correcting lower from the $ 28,800 zone. BTC might gain bearish momentum if there is a clear move below the $ 27,500 support.
- Bitcoin started another decline from the $ 28,800 resistance zone.
- The price is trading below $ 28,500 and the 100 hourly simple moving average.
- There is a key bearish trend line forming with resistance near $ 28,100 on the hourly chart of the BTC/USD pair (data feed from Kraken).
- The pair could start another increase unless there is a clear move below the $ 27,500 support.
Bitcoin Price Corrects Lower
Bitcoin price managed to climb further higher above the $ 28,500 resistance level. However, BTC struggled to gain pace for a move above the $ 28,800 and $ 29,000 levels.
The recent swing high was formed near $ 28,595 before there was a downside correction. The price declined below the $ 28,200 support level and the 100 hourly simple moving average. The bears pushed the price below the $ 28,000 support zone.
A low is formed near $ 27,578 and the price is now consolidating losses. Bitcoin price is now trading above $ 28,200 and the 100 hourly simple moving average. There is also a key bearish trend line forming with resistance near $ 28,100 on the hourly chart of the BTC/USD pair.
An immediate resistance is near the $ 27,820 level. It is near the 23.6% Fib retracement level of the downward move from the $ 28,595 swing high to $ 27,578 low.
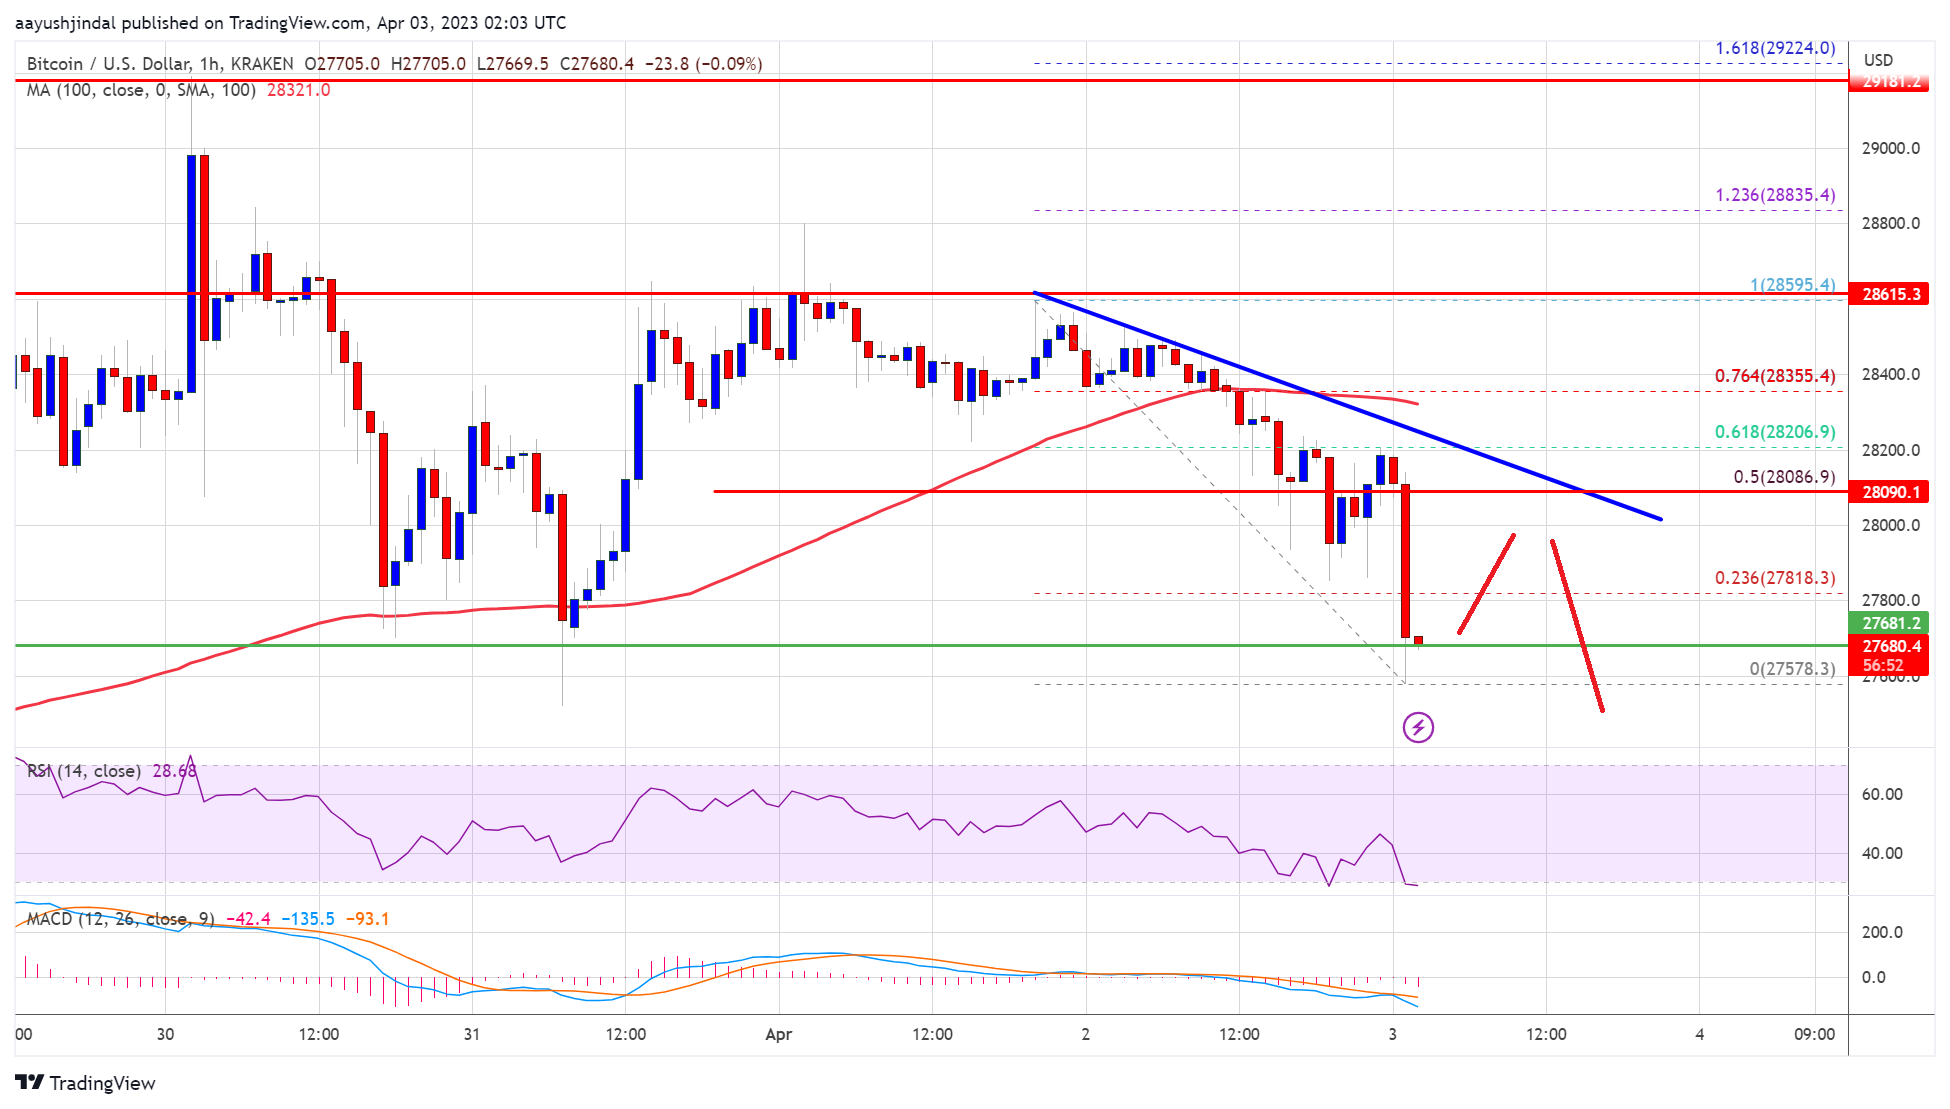
Source: BTCUSD on TradingView.com
The next major resistance is near the $ 28,100 zone and the trend line. It is close to the 50% Fib retracement level of the downward move from the $ 28,595 swing high to $ 27,578 low. The main resistance is now forming near the $ 28,800 level. A clear move above the $ 28,800 level might pump the price towards the $ 29,200 resistance. Any more gains might call for a test of the $ 30,000 resistance zone.
More Losses in BTC?
If bitcoin price fails to clear the $ 28,100 resistance, it could start another decline. An immediate support on the downside is near the $ 27,600 zone.
The next major support is near the $ 27,500 zone. A downside break below the $ 27,500 support might spark a fresh decline. The next major support is near the $ 27,000 level, below which the price might test $ 26,600.
Technical indicators:
Hourly MACD – The MACD is now gaining pace in the bearish zone.
Hourly RSI (Relative Strength Index) – The RSI for BTC/USD is now below the 50 level.
Major Support Levels – $ 27,500, followed by $ 27,000.
Major Resistance Levels – $ 28,100, $ 28,500 and $ 28,800.