Fetch.AI (FET) Prints Strong Bullish Signal, Targets 500% Spike
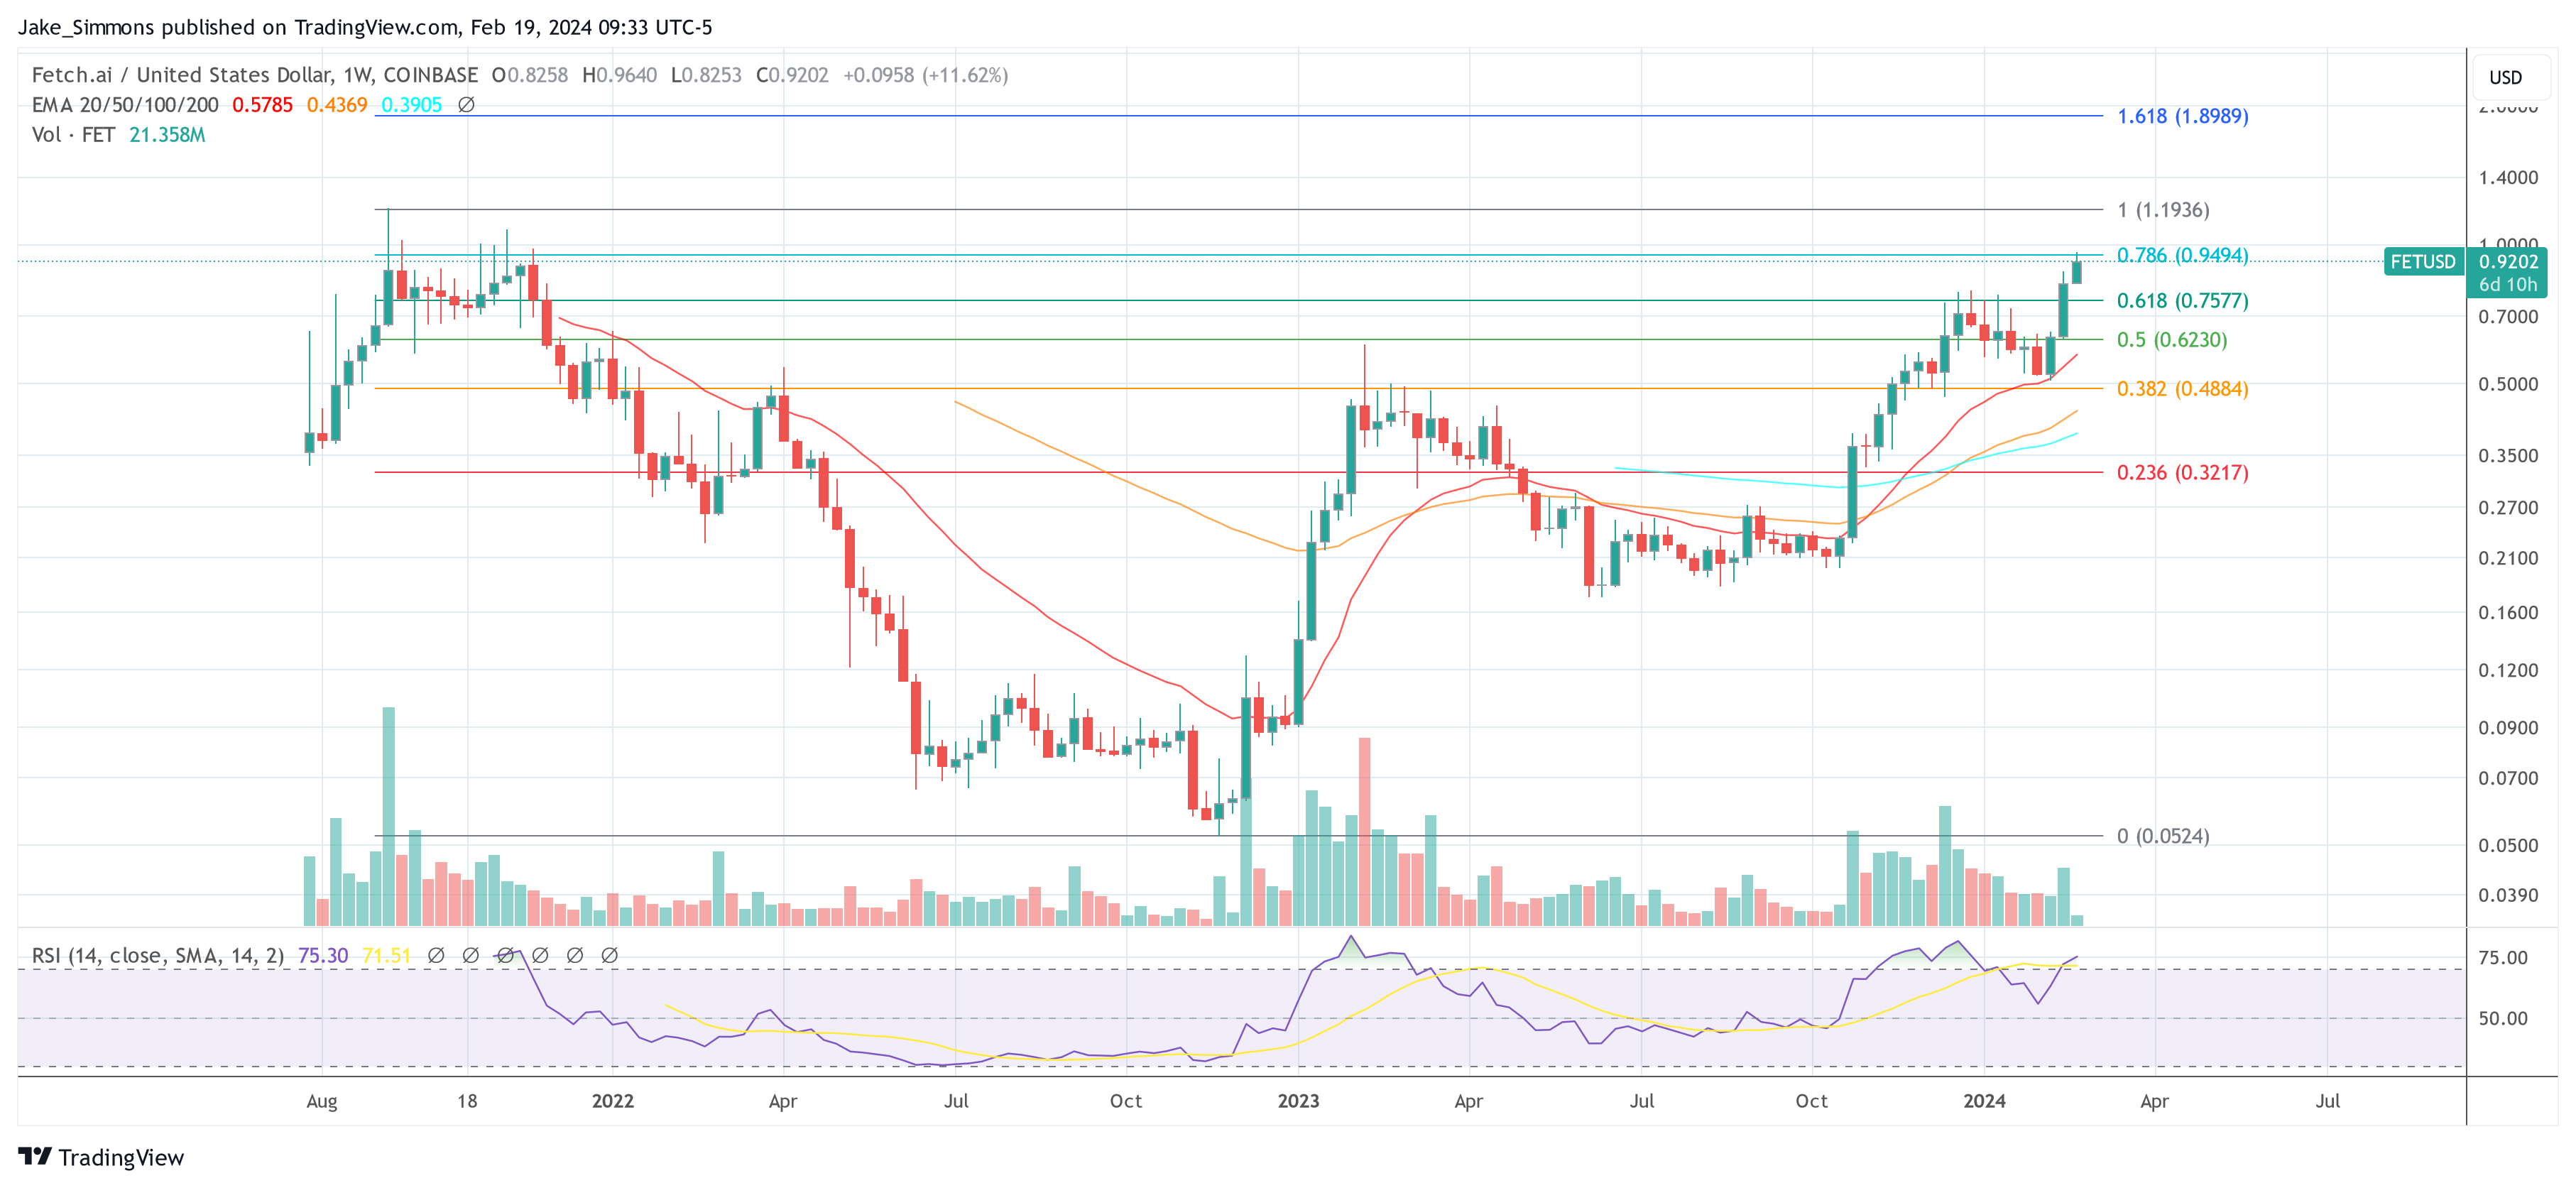
In a new technical analysis, renowned crypto analyst Gert van Lagen forecasts a 500% surge in the value of Fetch.AI (FET), with a price target of $ 5.5. This bold prediction comes as the AI-centric cryptocurrency coin, FET, records a 12% increase over the past 24 hours and an impressive 45% gain over the last week.
Currently trading with a momentum that correlates with the buzz around AI technology giant Nvidia, Fetch.AI is riding the wave of heightened interest as Nvidia approaches its Q4 2023 earnings release on February 21.
Nvidia’s stock has experienced a remarkable 45% surge since their previous earnings report, expanding its market cap by an unprecedented $ 600 billion. As the tech community anticipates Nvidia’s next financial update, speculation abounds regarding the potential influence of the company’s performance on the broader AI and cryptocurrency markets.
FET, along with other AI-tied tokens such as The Graph (GRT), Injective (INJ), Render Network (RNDR), and SingularityNET (AGIX), stands at a critical juncture where Nvidia’s financial results could significantly sway investor sentiment within the AI and crypto sectors. A positive report from Nvidia could catalyze a wave of enthusiasm, potentially bolstering investments in AI-dedicated cryptocurrencies.
Fetch.AI (FET) Eyes A 500% Rally
Van Lagen’s chart showcases a massive inverse ‘Head and Shoulders’ (H&S) pattern, consisting of three troughs: the left shoulder formed in early 2022, the head reached its nadir at the end of 2022, and the right shoulder developed in August 2023.
The pattern is characterized by a ‘neckline,’ which is a resistance level that the price must surpass to confirm the reversal. For Fetch.AI, the neckline is situated around the $ 0.5 mark, a threshold that was successfully retested as support in January 2024. This retest is seen as a bullish confirmation, reinforcing the integrity of the reversal pattern.
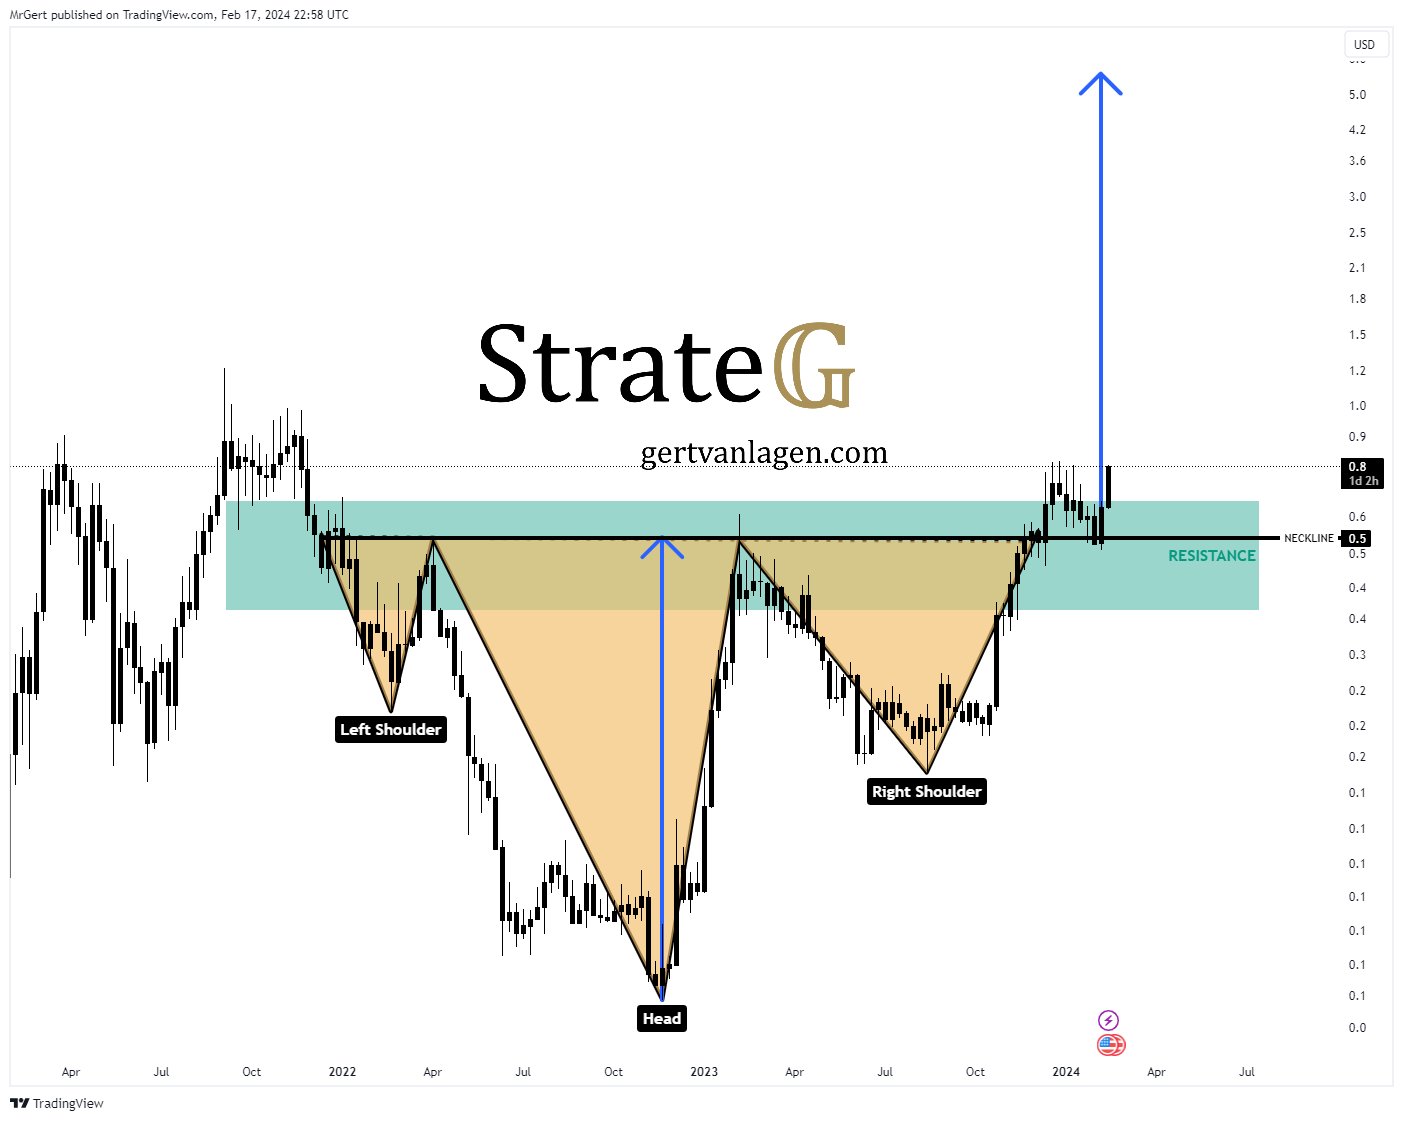
A noteworthy element in the analysis is the decisive breakout from the green Fibonacci resistance zone last week. The Fibonacci retracement tool is commonly used to ascertain potential support and resistance zones, and a breach beyond these confines typically suggests a strong market conviction.
Thus, Fetch.AI has not only surmounted the neckline but has also made strides past the resistance zone, paving the way for the asset to strive towards new all-time highs. Van Lagen has calculated a technical target for the iH&S pattern at $ 5.5, extrapolated from the depth of the pattern’s head to the neckline, and projected upwards from the breakout point.
The analyst has also stipulated a condition for the invalidation of this bullish scenario: should Fetch.AI print a ‘lower low’ (LL), it would disrupt the structure of the iH&S pattern and potentially signal a bearish shift in the market’s sentiment. He summarizes:
FET [1W] – Head and Shoulders bottom playing out neatly: + Dec-23 breakout of the right shoulder & the green Fib resistance zone; + Jan-24 multi-week successful retest of the neckline; + Feb-24 clearance for new ATHs Technical target iH&S: $ 5.5 Invalidation: print LL
At press time, FET traded at $ 0.92.