
Charted: Ripple (XRP) Retreats Sharply, $0.50 Is The Key For Next Increase
Ripple retested the $ 0.7500 resistance level before a sharp decline against the US Dollar, similar to bitcoin and ETH. XRP price is holding the $ 0.5500 support, but it might even test $ 0.5000.
- Ripple started a strong downside correction after it failed to clear $ 0.7500 against the US dollar.
- The price broke the $ 0.6000 support, but it is still well above the 100 simple moving average (4-hours).
- There was a break below a key contracting triangle with support near $ 0.6465 on the 4-hours chart of the XRP/USD pair (data source from Kraken).
- The pair could revisit the main $ 0.5000 support before the fresh increase in the near term.
Ripple’s XRP Price Approaching Key Supports
There was a strong rejection pattern formed in ripple’s XRP price near $ 0.7200 and $ 0.7500. The price started a strong decline and broke many supports near the $ 0.6200 level.
Recently, the crypto market saw a sharp correction, with a strong decline in bitcoin and Ethereum. XRP also followed a similar pattern and declined over 10% below $ 0.6000. There was also a break below a key contracting triangle with support near $ 0.6465 on the 4-hours chart of the XRP/USD pair.
The pair even broke the $ 0.5800 support zone, but it is still well above the 100 simple moving average (4-hours). There was a break below the 50% Fib retracement level of the upward wave from the $ 0.4085 swing low to $ 0.7876 swing high.
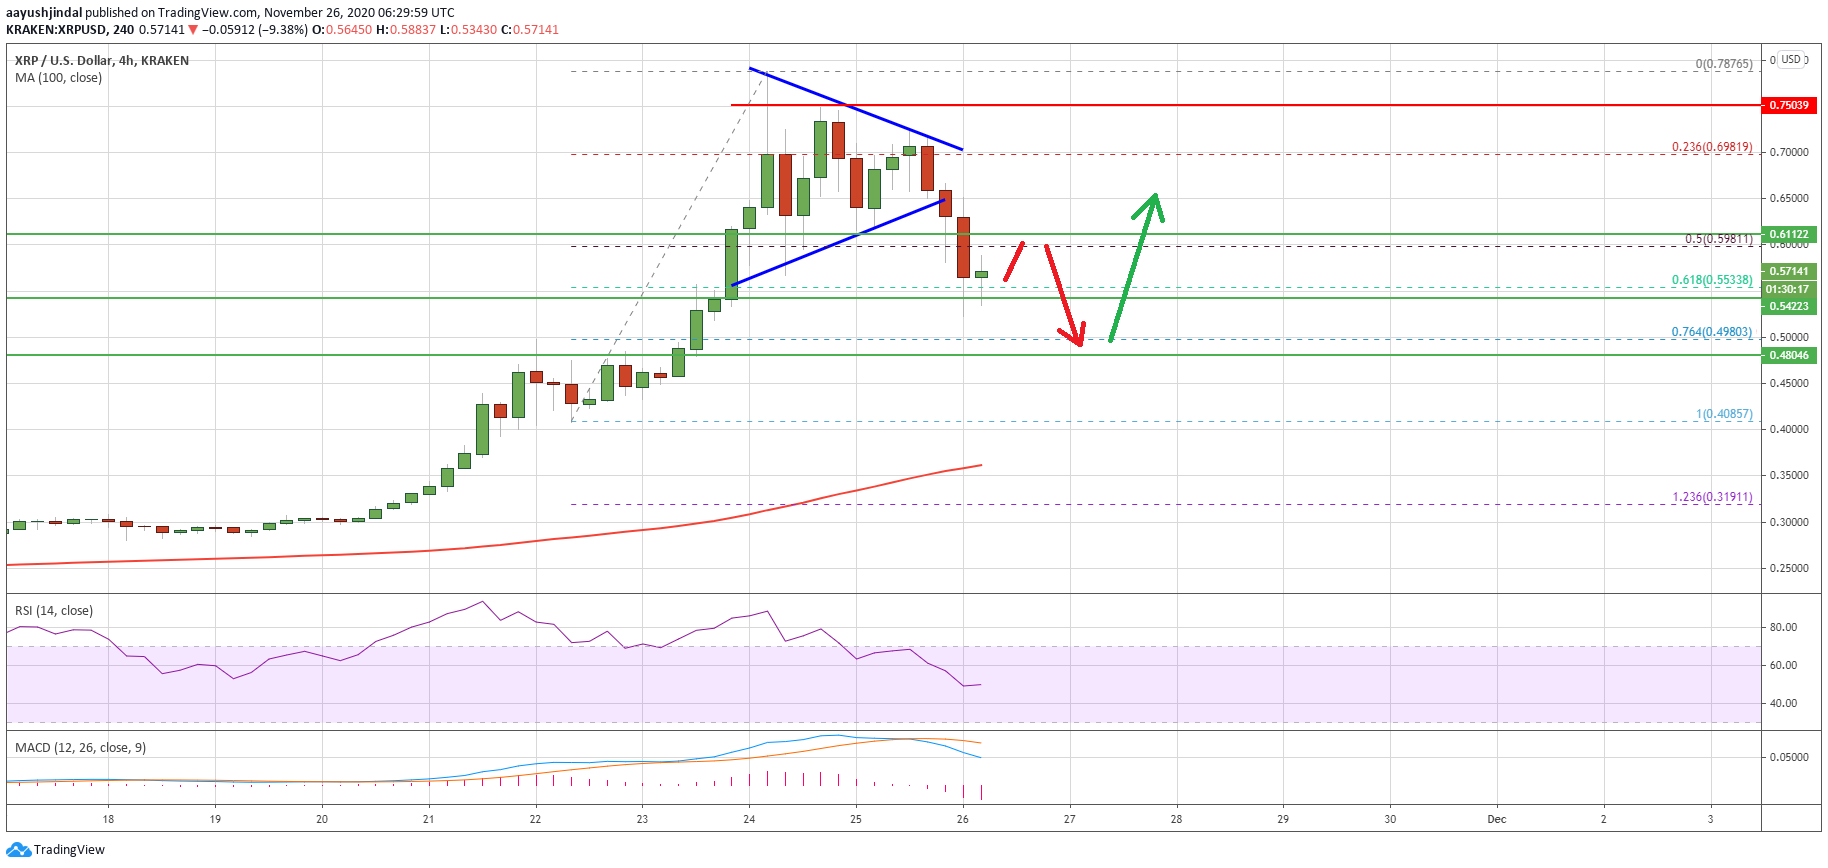
Source: XRPUSD on TradingView.com
It is now trading near the $ 0.5500 support level. The 61.8% Fib retracement level of the upward wave from the $ 0.4085 swing low to $ 0.7876 swing high is also acting as a support.
If there are more losses, the price could decline below the $ 0.5500 and $ 0.5400 levels. The next major support sits at $ 0.5000, where the bulls are likely to take a strong stand.
Upsides Limited in XRP?
If ripple stays above the $ 0.5500 support, it could recover higher. An initial resistance on the upside is near the $ 0.5850 and $ 0.6000 levels.
A clear break above the $ 0.6000 resistance level could open the doors for a fresh increase. In the stated case, the price is likely to rise steadily towards the $ 0.6500 level.
Technical Indicators
4-Hours MACD – The MACD for XRP/USD is losing pace in the bearish zone.
4-Hours RSI (Relative Strength Index) – The RSI for XRP/USD is currently close to the 50 level.
Major Support Levels – $ 0.5500, $ 0.5200 and $ 0.5000.
Major Resistance Levels – $ 0.5850, $ 0.6000 and $ 0.6500.