Zhu Su’s exchange did $13.64 in volume akshually, Huobi in crisis: Asia Express
Huobi Global’s token crash and ongoing layoffs, 3AC founders deny reports of $ 1.26 in day 1 volume on new exchange and claim $ 373 on day 2.
BTC white paper hidden on macOS, Binance loses AUS license and DOGE news: Hodler’s Digest, April 2-8


Binance Australia Derivatives’ license revoked, the Bitcoin white paper is hidden on modern macOS and Dogecoin prices spike after Twitter’s icon change.
Price analysis 4/7: BTC, ETH, BNB, XRP, ADA, DOGE, MATIC, SOL, DOT, LTC


Bitcoin’s failure to clear the overhead resistance at $ 30,000 is attracting profit-booking in select altcoins.
zkSync Era’s ‘elegant’ fix for 921 ETH ‘stuck forever’ in smart contract


Matter Labs confirmed the funds are safe and that they’ve found an “elegant solution” to transfer the funds out.
Dogecoin Price Prediction: Doge Rally Faded But Not Likely Over

Dogecoin rallied over 25% and cleared the $ 0.090 resistance against the US Dollar. DOGE is correcting gains and might find fresh bids near the $ 0.088 support.
- DOGE gained pace and traded above the $ 0.090 resistance against the US dollar.
- The price is trading well above the $ 0.085 zone and the 100 simple moving average (4 hours).
- There is a key bearish trend line forming with resistance near $ 0.094 on the 4-hours chart of the DOGE/USD pair (data source from Kraken).
- The pair could start a fresh increase if there is a clear move above $ 0.0940.
Dogecoin Price Trims Gains
After Twitter’s logo change, Dogecoin’s price saw a strong upward move from the $ 0.0750 support. DOGE outperformed Bitcoin and Ethereum. It rallied over 25% and cleared many hurdles near $ 0.0850.
The bulls were able to pump the price above the $ 0.090 resistance. Finally, the price spiked above $ 0.10 and traded to a new monthly high at $ 0.1051. Recently, there was a downside correction below the $ 0.1000 level.
DOGE’s price declined below the $ 0.095 level. The price tested the 50% Fib retracement level of the recent rally from the $ 0.0765 swing low to the $ 0.1051 high. It is now consolidating gains well above the $ 0.085 zone and the 100 simple moving average (4 hours).
On the upside, the price is facing resistance near the $ 0.0940 level. There is also a key bearish trend line forming with resistance near $ 0.094 on the 4-hours chart of the DOGE/USD pair.
Source: DOGEUSD on TradingView.com
The first major resistance is near the $ 0.095 level. A clear move above the $ 0.095 resistance might send the price toward the $ 0.100 resistance. Any more gains might send the price toward the $ 0.105 level. A clear move above the $ 0.105 resistance could open the gates for an increase toward the $ 0.12 level.
Dips Supported in DOGE?
If DOGE’s price fails to gain pace above the $ 0.095 level, it could continue to move down. Initial support on the downside is near the $ 0.0905 level.
The next major support is near the $ 0.085 level or the 76.4% Fib retracement level of the recent rally from the $ 0.0765 swing low to the $ 0.1051 high. If there is a downside break below the $ 0.085 support, the price could decline further. In the stated case, the price might decline toward the $ 0.075 level.
Technical Indicators
4 Hours MACD – The MACD for DOGE/USD is now losing momentum in the bullish zone.
4 Hours RSI (Relative Strength Index) – The RSI for DOGE/USD is now above the 50 level.
Major Support Levels – $ 0.090, $ 0.085, and $ 0.075.
Major Resistance Levels – $ 0.0940, $ 0.0950, and $ 0.100.
Crypto could eliminate 97% of traditional remittance fees: Coinbase


United States consumers sending international bank transfers pay more than $ 12 billion annually in remittance fees alone.
Price analysis 4/3: SPX, DXY, BTC, ETH, BNB, XRP, ADA, MATIC, DOGE, SOL


Macroeconomic headwinds continue to pressure the crypto market, but bulls appear steadfast on holding $ 28,000 for support, and this could provide tailwinds for altcoins.
Bitcoin Price Dips Again As The Bulls Struggle To Push It To $30K

Bitcoin price is correcting lower from the $ 28,800 zone. BTC might gain bearish momentum if there is a clear move below the $ 27,500 support.
- Bitcoin started another decline from the $ 28,800 resistance zone.
- The price is trading below $ 28,500 and the 100 hourly simple moving average.
- There is a key bearish trend line forming with resistance near $ 28,100 on the hourly chart of the BTC/USD pair (data feed from Kraken).
- The pair could start another increase unless there is a clear move below the $ 27,500 support.
Bitcoin Price Corrects Lower
Bitcoin price managed to climb further higher above the $ 28,500 resistance level. However, BTC struggled to gain pace for a move above the $ 28,800 and $ 29,000 levels.
The recent swing high was formed near $ 28,595 before there was a downside correction. The price declined below the $ 28,200 support level and the 100 hourly simple moving average. The bears pushed the price below the $ 28,000 support zone.
A low is formed near $ 27,578 and the price is now consolidating losses. Bitcoin price is now trading above $ 28,200 and the 100 hourly simple moving average. There is also a key bearish trend line forming with resistance near $ 28,100 on the hourly chart of the BTC/USD pair.
An immediate resistance is near the $ 27,820 level. It is near the 23.6% Fib retracement level of the downward move from the $ 28,595 swing high to $ 27,578 low.
Source: BTCUSD on TradingView.com
The next major resistance is near the $ 28,100 zone and the trend line. It is close to the 50% Fib retracement level of the downward move from the $ 28,595 swing high to $ 27,578 low. The main resistance is now forming near the $ 28,800 level. A clear move above the $ 28,800 level might pump the price towards the $ 29,200 resistance. Any more gains might call for a test of the $ 30,000 resistance zone.
More Losses in BTC?
If bitcoin price fails to clear the $ 28,100 resistance, it could start another decline. An immediate support on the downside is near the $ 27,600 zone.
The next major support is near the $ 27,500 zone. A downside break below the $ 27,500 support might spark a fresh decline. The next major support is near the $ 27,000 level, below which the price might test $ 26,600.
Technical indicators:
Hourly MACD – The MACD is now gaining pace in the bearish zone.
Hourly RSI (Relative Strength Index) – The RSI for BTC/USD is now below the 50 level.
Major Support Levels – $ 27,500, followed by $ 27,000.
Major Resistance Levels – $ 28,100, $ 28,500 and $ 28,800.
FTX EU opens withdrawal, Elon Musk calls for AI halt, and Binance news: Hodler’s Digest, March 26–April 1


FTX Europe opens withdrawal for European customers, a petition seeks to halt AI development, and Binance is sued by U.S. authorities.
Bitcoin Market Structure Points To New Uptrend, Here’s Why

Bitcoin price is trading above $ 28,000, only roughly $ 4,000 away from doubling in value since the most recent low.
The recent changes in market structure in BTCUSD could indicate a new uptrend is taking form. Find out why below.
Bitcoin Price Forms Uptrend, Will It Sustain?
Bitcoin has outperformed nearly every other asset in finance in 2023. In recent weeks, it has been sucking the capital out of altcoins due to its seemingly unstoppable power in the face of a banking crisis.
With the top cryptocurrency by market cap trading just under $ 30,000 per coin, it’s now within striking distance of a key level that could signal that the bottom is in. After a bottom is in, a new bull run forms.
According to the BTCUSD price chart, Bitcoin could be on the brink of a new uptrend in the most definitive terms. In fact, an uptrend, in theory, is already active.

BTCUSD And Defining The Current Crypto Market Trend
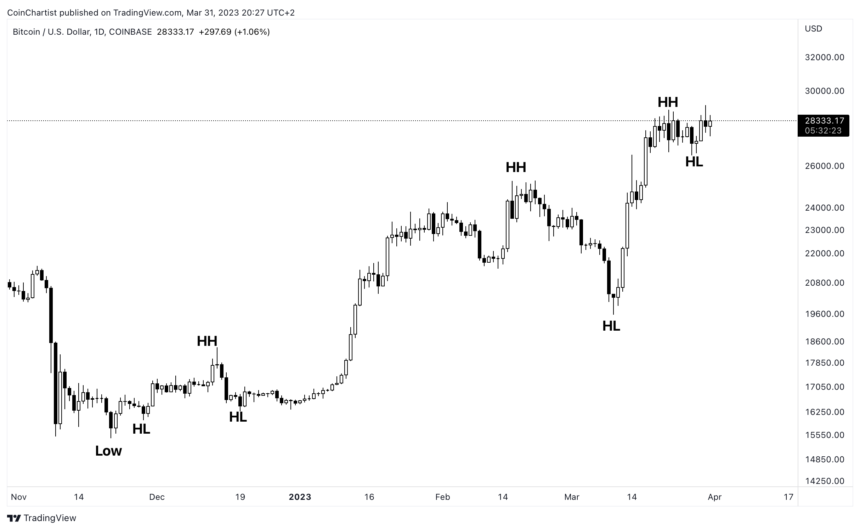
The Merriam-Webster dictionary refers to an uptrend as any upward turn in economic activity or business. More specifically to technical analysis, an uptrend is a series of higher highs and higher lows.
As BTCUSD or any asset follows this sequence of swing highs and swing lows (smaller fluctuations are allowed) the uptrend remains intact.
When a new lower low or lower high is set, the sequence breaks and market structure now becomes what is referred to as consolidation. If lower lows and lower highs form in a repeated series, then the market is now in a downtrend. It is that simple.
Since November 2022, Bitcoin price has set a series of higher highs and higher lows. If this continues, even the most bearish on BTC will have to admit that these conditions, by definition, indicate a new upward trend.
#Bitcoin is in an uptrend in the simplest sense of the term. pic.twitter.com/V8QXZtvcMY
— Tony "The Bull" (@tonythebullBTC) March 31, 2023


