XRP Price Surge: Crypto Analyst Predicts Various Bullish Scenarios In The Coming Days

Crypto analyst EGRAG crypto recently posted an analysis of the various scenarios for the price trajectory of XRP in the near future. XRP, like most top cryptocurrencies, has received many price predictions in the past few months, as the entire crypto market witnessed a consistent increase in activity throughout the fourth quarter of 2023.
However, predicting the future outlook of cryptocurrencies can be a very tricky endeavor, but this crypto analyst, known for his bullish stance on XRP, outlined different trajectories for XRP in the coming months, with some of them being more bullish than others.
Fundamentals And Technicals Point To A Bullish XRP
XRP has been on a roller coaster ride this year. The crypto went through the first half of the year still carrying on the burden surrounding Ripple’s lawsuit with the SEC since 2020. By the second half of 2023, XRP became the first cryptocurrency with legal clarity in the US. This caused its price to skyrocket from $ 0.46 in less than 24 hours to $ 0.82, the highest point in 15 months.
Despite the crypto still being up by 80.45% this year, the price has since corrected, and XRP is now trading at $ 0.6225. According to crypto analyst EGRAG’s analysis, the crypto is still in a bullish mindset that would send it over $ 1 in the coming months, a price level it hasn’t seen since November 2021.
#XRP Color Code To $ 1.4:
If #XRP triumphantly closes above the Fib 0.5 level at 0.57C with undeniable confirmation, we’re setting our sights on the $ 1.4!. This meteoric rise is just around the corner.
But remember, there’s more to this story! Dive into the color-coded clues… pic.twitter.com/DC0ss6Ip27
— EGRAG CRYPTO (@egragcrypto) September 21, 2023
XRP Price Scenarios and Potential Trends
Under the first scenario presented by EGRAG, XRP will reach $ 1.10 by February 2024. However, the crypto could revisit another swing low at $ 0.55 to $ 0.58 before making this bullish run. If this happens, it would make it much easier for the crypto to to achieve multiplier factors over 10X and 20X.
In the second possible outcome, XRP will surge to $ 1.4 in the first quarter of 2024. EGRAG noted that the eventual approval of spot Bitcoin ETFs in the US could turn out to be a sell-the-news event, which could see XRP crashing back down to $ 0.75 to $ 0.80 between July and September 2024. If this scenario were to play out, the $ 0.80 to $ 0.85 price level would become a strong “MACRO Resistance” for future price action.
In the third and most bullish scenario, XRP and the entire crypto market will surge alongside Bitcoin after the approval of spot ETFs in the US. As a result, XRP could easily surpass its current all-time high by March 2024 and might peak between $ 2.2 to $ 2.8.
It’s important to note that the crypto industry will become open to traditional investors by this point, including big Wall Street investors. EGRAG warned of potential manipulation of retail investors by the “big boys,” adding that “they are ruthless and only few will survive and emerge victorious.”
Featured image from Pexels
Goldman Sachs Exec Predict Massive Growth For Digital Assets In 2024
Head of Digital Assets at Goldman Sachs, Matthew McDermott, has projected a massive growth in the cryptocurrency market in 2024. McDermott shared these positive predictions in a recent interview with Fox Business, expressing much optimism in the future of digital assets.
Goldman Exec Expects Spot ETFs To ‘Gradually’ Boost Institutional Demand For Crypto Assets
Speaking to Fox Business, McDermott has backed the continuous growth of cryptocurrencies as he foresees a rise in the institutional adoption of these assets.
Notably, the Goldman executive shares popular sentiment with many crypto enthusiasts that the approval of a Bitcoin or Ethereum spot ETF will open up the digital asset ecosystem to more institutional investors who are weary of the market volatility attached to direct crypto investments.
McDermott said:
One, it broadens and deepens the liquidity in the market. And why does it do that? It does that because you’re actually creating institutional products that can be traded by institutions that don’t need to touch the bare assets. And I think that, to me, that opens up the universe of the pensions, insurers, etc.
However, McDermott has cautioned crypto enthusiasts against expecting a sudden impact of crypto spot ETFs. He believes the anticipated increased demand and price rise will be a gradual process that will occur over the course of 2024.
The US Securities and Exchange Commission (SEC) is expected to grant approval orders to several Bitcoin spot ETF applications in the coming weeks following discussions between the regulator and multiple asset managers. Bloomberg analyst Eric Balchunas has set a potential decision window of January 8 – January 10, stating there is a 90% chance the SEC finally delivers a verdict on these various applications putting an end to the 6-months chronicle.
Asset Tokenization In 2024
In addition to potential crypto spot ETFs, McDermott also mentioned a potential increase in commercial blockchain application as another contributing factor to his projected rise in institutional demand for digital assets.
Particularly, he spoke about an improvement in existing tokenization systems, which can lead to the creation of secondary liquidity on blockchains.
He said:
When I think about tokenization, which is obviously a topic that’s kind of talked about quite extensively, I think for me next year what we’ll start to see is the development of marketplaces. So where we start to see scale adoption, particularly across the buy side in the context of investors. And that’s because we’ll start to see the emergence of secondary liquidity on chain, and that’s a key enabler. So for me, that’s one of the key developments for next year.”
At the time of writing, the entire crypto ecosystem is valued at $ 1.602 trillion, with a 15.09% gain in the last month. The market’s leader Bitcoin currently trades at $ 42,082, having declined by 1% in the past day.
MATIC Blasts Off: 20% Surge As Polygon Trading Volume Hits Records

The global cryptocurrency market value has retraced to over $ 1.72 trillion, suggesting that the cryptocurrency industry has lost some of its momentum in the last day. Furthermore, MATIC has not seen any tiny losses, in contrast to the majority of prominent digital assets, such as Bitcoin.
As the Polygon protocol’s supporters push for new yearly highs, MATIC is experiencing a seismic change within its ecosystem, which has caused its price to soar by more than 20% in early trading on Thursday.
MATIC Breaches $ 1 Barrier
Based on the several milestones in its ecosystem, Polygon has been indicating that it is prepared to overcome the critical $ 0.9 pricing threshold.
Following an initial upward trend, MATIC made an unsuccessful attempt to break out in February 2023. Before the price broke out this week, there were two more failed breakout efforts in November and December.
The $ 1.07 peak on Wednesday is the highest since April. It is noteworthy that MATIC has failed to close each week above the resistance trend line.
Furthermore, some analysts say that MATIC may soon reach new peaks as it tries to keep a solid footing within – or even past – the $ 1 territory. Doctor Profit, a user on Twitter, is among those who endorse such theory.
$ MATIC is one of the most undervalued projects out there. If I wouldnt have bought tons of it at $ 0.50 I would heavily enter now as anything below $ 1 is a gift
Sooner or later its an easy double digit coin in the incoming bull. One of my favorite coins
— Doctor Profit
(@DrProfitCrypto) December 26, 2023
The expert called Polygon’s coin “one of the most undervalued projects” in the market and asserted that traders and investors should view its price below $ 1 as a “gift.”
Another expert, renowned cryptocurrency researcher Ali Martinez, shows that, based on his evaluation, MATIC is emerging from a symmetrical triangular formation.
Martinez thinks that a strong upward advance that might push MATIC towards the $ 1.73 price level could occur if Polygon is able to maintain a weekly candlestick close above the $ 0.96 threshold.
#Polygon is on the verge of a breakout from a symmetrical triangle. A sustained weekly candlestick close above $ 0.96 could propel $ MATIC towards $ 1.73! pic.twitter.com/IZQHpSuqO6
— Ali (@ali_charts) December 26, 2023
Optimistic Outlook: MATIC’s Promising Trajectory
According to this analysis, Polygon has a bright future ahead of it, especially if some important thresholds are broken.
The X cryptocurrency community is optimistic about the future of the MATIC price trend. After bouncing off a long-term support region, Pentosh1 predicts the price will keep moving upwards.
You can’t not like this setup. Have no idea how long it it will take to play out, just that it likely will probabilistically speaking
Historical support confluence, bull flagging for more. Yet to run but starting to find it’s flippers https://t.co/AMI5e9wxZA pic.twitter.com/RESMqmHGeI
— Pentoshi
euroPeng
(@Pentosh1) December 26, 2023

Meanwhile, Polygon’s trading volume has recently increased dramatically. According to DefiLlama, it crossed the $ 150 million milestone since the middle of the month and reached around $ 400 million on December 26.
With its impressive performance, Polygon’s native token MATIC has drawn attention as the protocol’s trading volume reaches a new milestone.
Featured image from Shutterstock
$2 In Sight? Mina Protocol’s 47% Growth Raises Price Target Hopes

In the whirlwind landscape of cryptocurrency, the Mina Protocol has taken center stage with an extraordinary 47% surge in its native token, MINA, within the past week.
Currently riding high at $ 1.40, a level not witnessed since May 2022, MINA’s impressive rally has ignited contemplation among investors: Can it breach the elusive $ 2 mark in the immediate future?

Mina’s Surge: CEO Appointment And Swiss Relocation
This surge in MINA’s value is not a mere coincidence; it’s the result of a convergence of significant developments that have unfolded in recent weeks.
December 19 marked a pivotal moment when the Mina Foundation announced the appointment of Kurt Hemecker as the new CEO, a distinguished business development specialist in the FinTech space.
Simultaneously, the foundation strategically relocated its operations to Geneva, Switzerland, amplifying the positive sentiment surrounding MINA due to anticipated regulatory benefits and enhanced networking opportunities within the cryptocurrency community.
Another driving force behind MINA’s remarkable surge is the introduction of the Paima ZK layer. A collaborative effort involving Paima Studios, Mina, ZekoLabs, and Class Lambda, this layer represents a groundbreaking leap in blockchain gaming technology.
It can deploy Zero-Knowledge (ZK) proofs to any Layer 1 (L1) ecosystem, supporting both EVM and non-EVM codebases. The layer’s innovative capacity to enable dynamic scaling of on-chain games, akin to the traditional “world select” in web2 games, adds a novel dimension to MINA’s utility.
The Mina Foundation Board appoints Kurt Hemecker (@khem) as CEO to champion adoption of @MinaProtocol’s ZK tech.
Kurt, previously COO, brings two decades of business development experience from major players including @DiemAssociation and @PayPal.
— Mina Foundation
(@MinaFoundation) December 19, 2023
MINA Faces Resistance At Recent Highs
Despite the positive momentum, MINA encounters initial resistance at its recent peak of $ 1.48, with additional overhead resistance noted between $ 1.5817 and $ 1.6337.
While the broader trend remains upward, cautious optimism is warranted as short-term oscillators hint at early signs of peaking momentum, prompting vigilance among traders and investors alike.
Meanwhile, Sebastien Guillemot, the principal developer at Cardano, alluded to significant advancements for the blockchain in 2024 in a recent X post.
With Ethereum sentiments being in the dumps right now, I’d just like to say working with Arbitrum (@arbitrum) has been a great experience
Expect more projects that combine Arbitrum with @cardano and @MinaProtocol in the 2024
— Sebastien Guillemot (@SebastienGllmt) December 26, 2023
Guillemot’s expressed enthusiasm about collaborating with Arbitrum suggests a potential fusion of Cardano with Arbitrum and Mina Protocol.
Paima Studios, under Guillemot’s leadership, has already contributed to the progression of Layer-2 solutions, releasing a solution for Cardano’s on-chain gaming this year.
The alignment with Arbitrum and Mina Protocol points toward a paradigm shift in the blockchain landscape, promising further innovation and seamless integration.
Featured image from Shutterstock
PanCakeSwap Soars Over 50% After 10 Million Tokens Burned – Details

The recent increase in value of PancakeSwap has captured the attention of the cryptocurrency community, as its token, CAKE, witnessed an extraordinary 54% surge in just the past seven days.
With a robust market capitalization of nearly $ 900 million and an impressive fully diluted valuation of $ 1.3 billion, PancakeSwap has solidified its position as a significant player in the decentralized finance (DeFi) space.
Strategic Token Burn Propels PanCakeSwap Ascendancy
One of the key strategies contributing to PancakeSwap’s success lies in its proactive approach to managing token supply.
In a strategic move to boost scarcity and create a more attractive investment proposition, PancakeSwap executed a token burn, incinerating more than 10 million CAKE tokens, valued at approximately $ 34 million, on December 26.
This deliberate reduction in the total supply by 40% has not only impressed investors but also earned PancakeSwap the endearing title of “everyone’s favorite DEX” (Decentralized Exchange).
10,166,225 $ CAKE just burned – that’s $ 34M!
Trading fees (AMM V2): 132k CAKE ($ 438k) -29%
Trading fees (AMM V3): 79k CAKE ($ 260k) -23%
Trading fees (Non-AMM like Perpetual, Position manager etc): 4k CAKE ($ 1k) -98%
Prediction: 34k CAKE ($ 112k) -27%
Lottery &… pic.twitter.com/veRsDhcFFB
— PancakeSwap
Everyone’s Favorite DEX (@PancakeSwap) December 26, 2023
Despite prevailing market consolidation, the CAKE token has managed to defy the odds, maintaining a price above $ 2.1 and extending its recovery trend. Within just one week, the coin’s price soared to the current trading value of $ 3.37, breaking decisively from a falling wedge pattern.
This latest burn has resulted in a notable reduction in the circulating supply of CAKE tokens, decreasing from 275 million to 265 million. Consequently, this development propelled the CAKE price by 18%, pushing its market cap to $ 894 million.
Crypto burns play a pivotal role in the digital assets sector by reducing asset supply, thereby creating heightened demand and boosting the value and prices of cryptocurrencies.
Although a proposal to cap the maximum supply at 450 million was previously made by the network to recover losses suffered by CAKE crypto, it is yet to be implemented. Meanwhile, the team will continue with substantial burns to support price movement until an alternative decision is reached.
Weekly Token Burns Signal PanCakeSwap’s Commitment
The PancakeSwap team has further disclosed their intention to continue these token burns on a weekly basis, demonstrating a commitment to this approach until a decision is made to alter it.
This diminishing supply, coupled with the optimistic technical outlook, is anticipated to sustain a robust recovery trend in CAKE price.
Meanwhile, the coin’s 24-hour trade volume increased by 37% to $ 284 million, with one-month gains exceeding 50%. Moreover, the token reached a new 30-day peak of $ 3.65 on Tuesday.
As of the latest update, CAKE maintains a bullish stance, registering a 27% increase in the previous day’s trading and gaining over 6% within one hour of the most recent token burn.
The altcoin has also garnered increased crowd interest, with daily volume soaring by 75% to $ 330 million, although it remains 90% down from its April 2021 all-time high of $ 44.20.
Featured image from Shutterstock
XRP Price Regains Strength As The Bulls Aim For 10% Surge
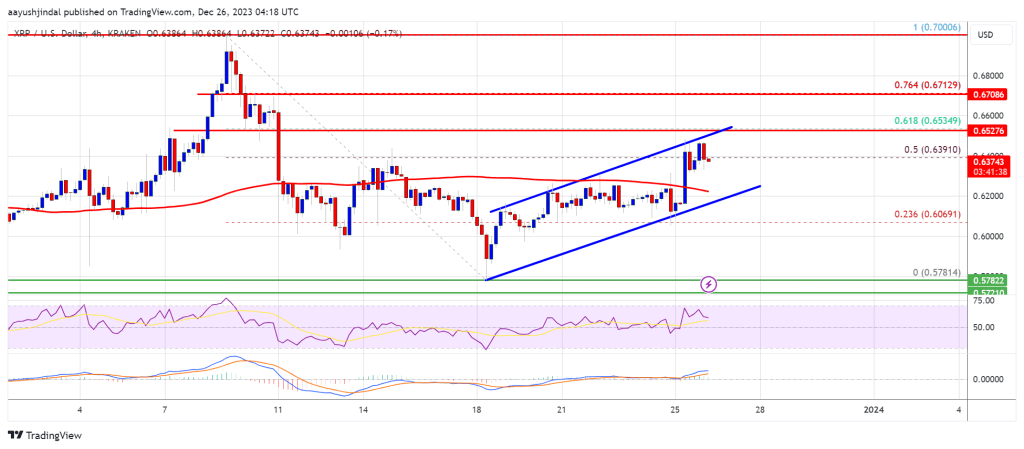
XRP price is moving higher from the $ 0.578 support. The price seems to be setting up for a fresh surge toward the $ 0.680 and $ 0.700 levels.
- XRP is attempting a fresh increase from the $ 0.578 support level.
- The price is now trading above $ 0.620 and the 100 simple moving average (4 hours).
- There is a key rising channel forming with resistance near $ 0.650 on the 4-hour chart of the XRP/USD pair (data source from Kraken).
- The pair start a fresh rally if it clears the $ 0.650 and $ 0.655 resistance levels.
XRP Price Could Surge To $ 0.70
After forming a base near the $ 0.578 zone, XRP price started a decent increase. There was a move above the $ 0.595 and $ 0.600 resistance levels. The price even cleared the $ 0.630 resistance.
There was a spike above the 50% Fib retracement level of the downward move from the $ 0.700 swing high to the $ 0.578 swing low. The price is now up over 3%, outperforming Bitcoin and Ethereum. It is now facing resistance near the $ 0.650 zone.
There is also a key rising channel forming with resistance near $ 0.650 on the 4-hour chart of the XRP/USD pair. The channel resistance is near the 61.8% Fib retracement level of the downward move from the $ 0.700 swing high to the $ 0.578 swing low.
The price is now trading above $ 0.630 and the 100 simple moving average (4 hours). On the upside, immediate resistance is near the $ 0.650 zone. The next major resistance is near the $ 0.655 zone. A close above the $ 0.655 resistance zone could spark a strong increase.
Source: XRPUSD on TradingView.com
The next key resistance is near $ 0.684. If the bulls remain in action above the $ 0.684 resistance level, there could be a rally toward the $ 0.700 resistance. Any more gains might send the price toward the $ 0.720 resistance.
Fresh Decline?
If XRP fails to clear the $ 0.650 resistance zone, it could start a fresh decline. Initial support on the downside is near the $ 0.620 zone and the channel trend line.
The next major support is at $ 0.606. If there is a downside break and a close below the $ 0.606 level, XRP price might accelerate lower. In the stated case, the price could retest the $ 0.578 support zone.
Technical Indicators
4-Hours MACD – The MACD for XRP/USD is now gaining pace in the bullish zone.
4-Hours RSI (Relative Strength Index) – The RSI for XRP/USD is now above the 50 level.
Major Support Levels – $ 0.620, $ 0.606, and $ 0.578.
Major Resistance Levels – $ 0.650, $ 0.655, and $ 0.700.
Bitcoin Price Dips On The Christmas Day But Dips Still Attractive
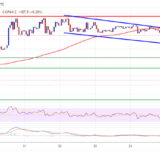
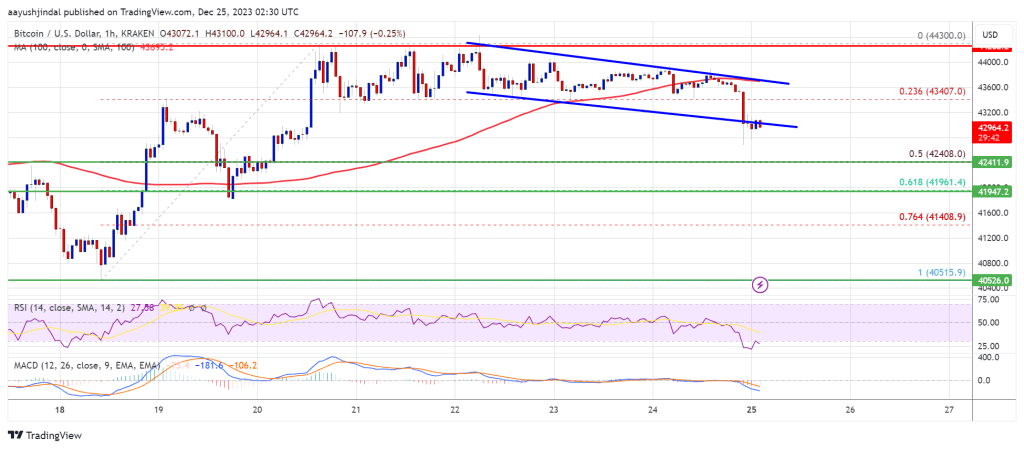
Bitcoin price failed to extend gains above the $ 44,300 resistance. BTC is now moving lower and might find bids near the $ 42,400 support zone.
- Bitcoin started a downside correction from the $ 44,300 resistance zone.
- The price is trading below $ 43,500 and the 100 hourly Simple moving average.
- There is a key declining channel forming with support near $ 42,850 on the hourly chart of the BTC/USD pair (data feed from Kraken).
- The pair could start a fresh increase from the $ 42,400 support zone.
Bitcoin Price Tops Again
Bitcoin price attempted a fresh increase above the $ 43,500 resistance zone. BTC climbed above the $ 44,000 level, but the bears were active near the $ 44,300 zone.
A high was formed near $ 44,300 and the price started a fresh decline. The price declined below the $ 44,000 and $ 43,500 levels. There was a move below the 23.6% Fib retracement level of the upward move from the $ 40,515 swing low to the $ 44,300 high.
Bitcoin is now trading below $ 43,500 and the 100 hourly Simple moving average. There is also a key declining channel forming with support near $ 42,850 on the hourly chart of the BTC/USD pair.
The pair is now testing the channel support, below which it might accelerate lower toward $ 42,400 or the 50% Fib retracement level of the upward move from the $ 40,515 swing low to the $ 44,300 high. If the bulls protect the channel support, there might be a fresh increase.
On the upside, immediate resistance is near the $ 43,500 level. The first major resistance is forming near $ 44,000 and $ 44,300. A close above the $ 44,300 resistance could start a strong rally and the price could even clear the $ 45,000 resistance.
Source: BTCUSD on TradingView.com
The next key resistance could be near $ 46,500, above which BTC could rise toward the $ 47,200 level. Any more gains might send the price toward $ 48,000.
More Losses In BTC?
If Bitcoin fails to rise above the $ 43,500 resistance zone, it could continue to move down. Immediate support on the downside is near the $ 42,800 level.
The next major support is near $ 42,400. If there is a move below $ 42,400, there is a risk of more losses. In the stated case, the price could drop toward the $ 41,200 support in the near term.
Technical indicators:
Hourly MACD – The MACD is now gaining pace in the bearish zone.
Hourly RSI (Relative Strength Index) – The RSI for BTC/USD is now below the 50 level.
Major Support Levels – $ 42,400, followed by $ 41,200.
Major Resistance Levels – $ 43,500, $ 44,300, and $ 45,000.
Solana Saga Orders Scrapped As $30 Million BONK Token Package Overshadows Device’s Value
Solana (SOL) and its associated meme coin, Bonk (BONK), have witnessed remarkable surges in value, with SOL recording gains of over 71% and Bonk experiencing an astonishing 342% increase over the past 30 days.
The positive growth within the Solana ecosystem has resulted in a surge in demand for the flagship mobile device, Solana Saga. However, the Solana Mobile team recently addressed challenges in meeting the “overwhelming demand” and explained order cancellations and inventory management issues.
Solana Mobile Faces Inventory Mishap
Over the past month, SOL has seen a significant uptrend, inching closer to the $ 100 mark, a level not reached since April 2022. Additionally, Bonk has experienced an extraordinary surge reaching a trading value of $ 0.00001896.
Given these developments and the social buzz within the blockchain and its mobile device, the Solana Mobile team confirmed that their limited inventory of 20,000 devices worldwide has sold out, with both the US and EU markets experiencing high demand.
According to a recent statement on X (formerly Twitter), in the process of fulfilling orders, the Solana Mobile team encountered an “inventory management issue” with their third-party distributor. This issue resulted in an inaccurate representation of the available inventory.
Consequently, the team was unable to fulfill orders placed after the inventory was depleted. Additionally, orders suspected of suspicious activity, such as excessive device orders or payment risks, were flagged and subsequently canceled.
According to the announcement, the objective behind these measures is to ensure that as many users as possible can enjoy the Solana Saga mobile device.
Customers affected by the order cancellations have been promptly notified, and they will receive refunds within the coming days.
Solana’s DEX Volume Overtakes Ethereum And Arbitrum
The Solana ecosystem, together with its native token SOL, has recently achieved significant milestones. Notably, Solana’s 24-hour decentralized exchange (DEX) volume has exceeded that of Ethereum (ETH) and Arbitrum (ARB) combined, surpassing the $ 2 billion mark.
Additionally, Solana has emerged as the third-largest altcoin (only behind BNB) by market capitalization. These achievements reflect the growing popularity and success of Solana within the cryptocurrency market.
According to Token Terminal data, SOL’s market cap (circulating) stands at $ 41.05 billion, reflecting a remarkable increase of 46.98%, flipping XRP’s market cap by over $ 7 billion.
The revenue generated has also witnessed substantial growth, with an 80.43% increase to $ 2.39 million. Furthermore, SOL’s fully diluted market cap has reached $ 54.31 billion, showcasing a significant rise of 45.60%.
The revenue generated on the Solana platform, when annualized, amounts to an impressive $ 29.13 million, signifying a substantial increase of 94.75%.
Examining SOL’s financial ratios, the price-to-fully diluted ratio stands at 796.78x, indicating the market’s high expectations for future growth. However, this ratio has experienced a recent decrease of 19.3%.
Featured image from Shutterstock, chart from TradingView.com
Bitcoin Price Rejects $43.5K, Why BTC Could Tumble In Short-Term
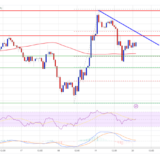
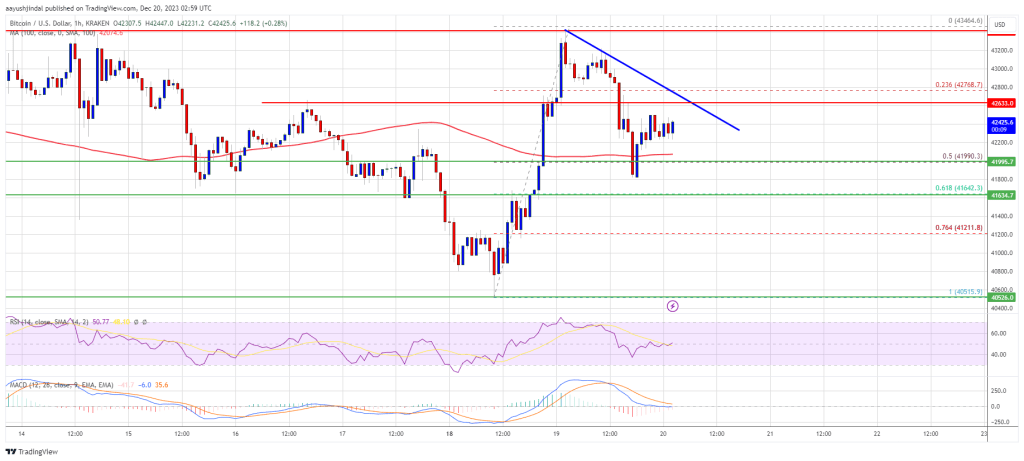
Bitcoin price attempted a fresh upside break above the $ 43,500 resistance. BTC failed and corrected lower to test the $ 41,800 support zone.
- Bitcoin is correcting gains from the $ 43,500 resistance zone.
- The price is trading above $ 42,000 and the 100 hourly Simple moving average.
- There is a connecting bearish trend line forming with resistance near $ 42,600 on the hourly chart of the BTC/USD pair (data feed from Kraken).
- The pair could continue to move down if there is a move below the $ 41,650 support.
Bitcoin Price Drops Again
Bitcoin price gained pace above the $ 42,000 resistance zone. BTC even climbed above the $ 43,000 level, but it faced a strong rejection near $ 43,500. It seems like the price failed again to clear the $ 43,500 zone.
A high was formed near $ 43,464 and the price started a fresh decline. There was a move below the $ 42,800 and $ 42,500 support levels. The price even spiked below the 50% Fib retracement level of the upward wave from the $ 40,514 swing low to the $ 43,464 high.
Bitcoin found support near the $ 41,800 level. It is now trading above $ 42,000 and the 100 hourly Simple moving average. The price is also stable above the 61.8% Fib retracement level of the upward wave from the $ 40,514 swing low to the $ 43,464 high.
On the upside, immediate resistance is near the $ 42,600 level. There is also a connecting bearish trend line forming with resistance near $ 42,600 on the hourly chart of the BTC/USD pair.
Source: BTCUSD on TradingView.com
The first major resistance is forming near $ 43,000. The main resistance is still near the $ 43,500 zone. A close above the $ 43,500 resistance might start a steady increase. The next key resistance could be near $ 44,500, above which BTC could rise toward the $ 45,000 level.
More Losses In BTC?
If Bitcoin fails to rise above the $ 42,650 resistance zone, it could continue to move down. Immediate support on the downside is near the $ 42,000 level.
The next major support is near $ 41,650. If there is a move below $ 41,650, there is a risk of more losses. In the stated case, the price could drop toward the $ 40,500 support in the near term.
Technical indicators:
Hourly MACD – The MACD is now gaining pace in the bearish zone.
Hourly RSI (Relative Strength Index) – The RSI for BTC/USD is now near the 50 level.
Major Support Levels – $ 42,000, followed by $ 41,650.
Major Resistance Levels – $ 42,650, $ 43,000, and $ 43,500.
Price analysis 12/18: SPX, DXY, BTC, ETH, BNB, XRP, SOL, ADA, AVAX, DOGE

Bitcoin may remain under pressure for a few days, but a collapse is unlikely, as traders are expected to buy the dips in anticipation of a spot Bitcoin ETF.


